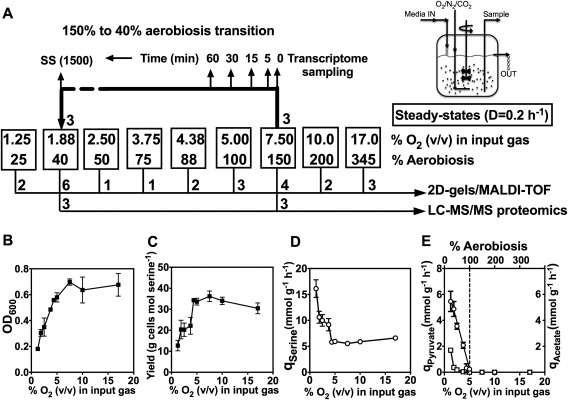
Figure 1.

Experimental design (A) and physiological parameters of C. jejuni growth in continuous culture (B–E). In (A), nine different conditions of oxygen availability were established in the chemostat by altering the composition of the input gas mixture. The boxed numbers show the % (v/v) of oxygen in the input gas and the corresponding degree of aerobiosis as calculated from the acetate excretion rate of the cells at steady‐state (panel E). A variable number of independent steady‐states derived from separate inocula were established at each of the nine oxygen input conditions, which were sampled for proteomics analysis by 2D‐gels and MALDI‐TOF MS of selected tryptically digested spots as described in Materials and Methods. The number of separate steady‐states used for this analysis is shown below the boxes. Three independent steady‐states at 150% and 40% aerobiosis were also subjected to LC‐MS/MS analysis after 1D‐gel separation for a more extensive proteome coverage. After steady‐states had been reached at 150% aerobiosis, the gas input was reduced to 1.88% (v/v) oxygen (40% aerobiosis). Samples from three such experiments were taken at different times during the transition as shown, for transcriptomic analysis by microarray analysis. Panel (B) shows the mean optical density at each steady‐state, panel (C) shows the mean growth yield on l‐serine at each steady‐state (determined from the cell dry weight and the amount of serine consumed), panel (D) shows the serine consumption rate (q Serine) and panel (E) shows the specific pyruvate (open squares) and acetate (open circles) excretion rates (q pyruvate and q Acetate). The linear relationship between q Acetate and the oxygen input was used to define the aerobiosis scale, where q Acetate = 0 = 100% aerobiosis. In (B–E), the errors bars show standard deviation of the mean.
