
Figure 1.
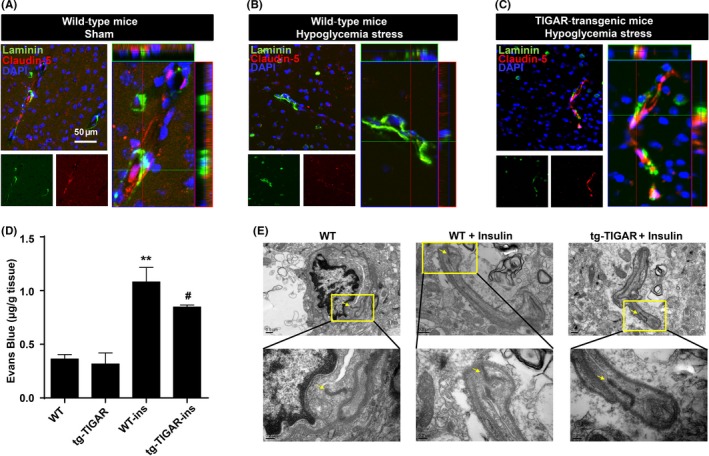
Vasoprotective role of TP53‐induced glycolysis and apoptosis regulator (TIGAR) during hypoglycemia stress in mice. (A‐C) Double immunohistochemical staining for laminin and claudin‐5 in the brain cortex after insulin‐induced hypoglycemia in wild‐type and tg‐TIGAR mice. Fluorescence staining for laminin (green) and claudin‐5 (red) was performed in the brain cortex 12 h after hypoglycemia‐induced brain injury in mice. Representative Z‐stack images were presented to confirm the co‐localization of laminin and claudin‐5 throughout the microvessels. Each image shown is representative of 5 independent mice. Scale bar: 50 μm. (D) Effect of TIGAR on BBB integrity upon hypoglycemic injury. Evans blue (μg/g brain tissue) levels in the brain cortex were examined by spectrophotometry in both WT and tg‐TIGAR mice 12 h after hypoglycemia‐induced brain injury. The data are expressed as the mean ± SEM.; n = 5 mice/group. **P < .01 vs wild‐type mice; # P < .05 vs wild‐type mice under hypoglycemic stress. (E) Ultrastructural changes in endothelial tight junctions in the brain cortex after hypoglycemic injury. Tight junction structures flanked by arrowheads in the images are shown at a larger magnification in lower panel. Hypoglycemia was induced by a single injection of insulin (2 units/kg body weight) in wild‐type and tg‐TIGAR mice. The mice were perfused with 4% paraformaldehyde and 0.25% glutaraldehyde and then processed for electron microscopic examination. The photomicrographs represent samples taken from 3 mice in each group