Figure 3.

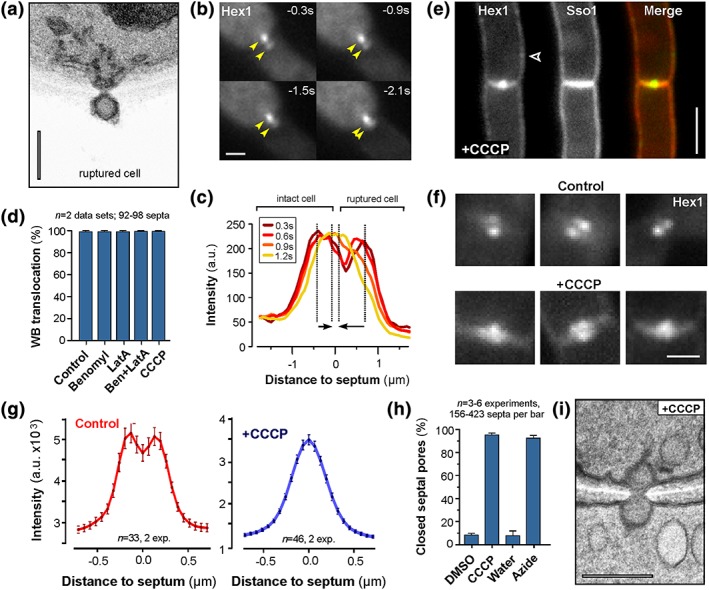
ATP‐dependent Woronin body (WB) closure of septal pores. (a) Electron micrograph showing plugged septal pores after wounding with quartz sand of the lower cell (ruptured cell). A single WB seals the pore in the dead compartment. Scale bar represents 0.2 μm. (b) Image series showing recruitment of WBs from the ruptured cell (dead) into the septum. Yellow arrowheads indicate fusion of the ZtHex1‐GFP signals in the septal pore. Time after wounding is given in seconds; scale bar indicates 1 μm. See also Movie S10 . (c) Graph showing fluorescent intensity scan curves of a pair of WBs over time. At 1.2 s after cell wounding, the WBs from the ruptured cell (left), as well as the WBs from the intact cell (right), have moved towards the septum and their fluorescent maximum overlaps. Arrows indicate the displacement of the intensity maxima over the 900‐ms observation time; time in seconds after wounding is indicated in box and colour coded. (d) Bar chart showing the number of septa that are sealed after laser rupture and in the presence of the microtubule inhibitor benomyl (Ben), the F‐actin inhibitor latrunculin A (LatA), and an inhibitor of oxidative phosphorylation (CCCP). Mean ± standard error of the mean is shown; sample size n is 2 data sets, 92–98 septa per bar, observed in >50 shooting experiments. (e) Zymoseptoria tritici cells expressing mCherry‐ZtSso1 and ZtHex1‐GFP that were treated with 100 μM CCCP for 15 min. The two septum‐associated WB signals fuse into one signal, which is located in the septal pore. In addition, small amounts of ZtHex1‐eGFP were found at the plasma membrane (arrowhead). Scale bar represents 3 μm. (f) Examples showing septum‐associated WBs in untreated control cells (upper gallery) and in CCCP‐treated cells (lower gallery). Depletion of cellular ATP concentrates WBs in the septal pore. Scale bar represents 1 μm. (g) Graph showing intensity curves over WBs at septa of control cells and after treatment with 100 μM CCCP for 15 min. In the presence of the respiration inhibitor, the bimodal distribution of ZtHex1‐GFP turns into a unimodal distribution, indicating that the WBs have moved into the septal pore. Note that the cells were not injured. Also note that CCCP treatment reduces the overall ZtHex1‐GFP fluorescent intensity in the cell. (h) Bar chart showing the number of septa that are sealed after treatment of 10–15 min with 100 μM CCCP or 0.1% sodium azide in unwounded multicellular structures. Mean ± standard error of the mean is shown; sample size n is 3–6 data sets, with 156–423 septa analysed per bar. (i) Electron micrograph showing WBs at septal pores in CCCP‐treated cells (+CCCP). Reducing the ATP levels results in WBs plugging on both sides of the septum. Scale bar represents 0.2 μm
