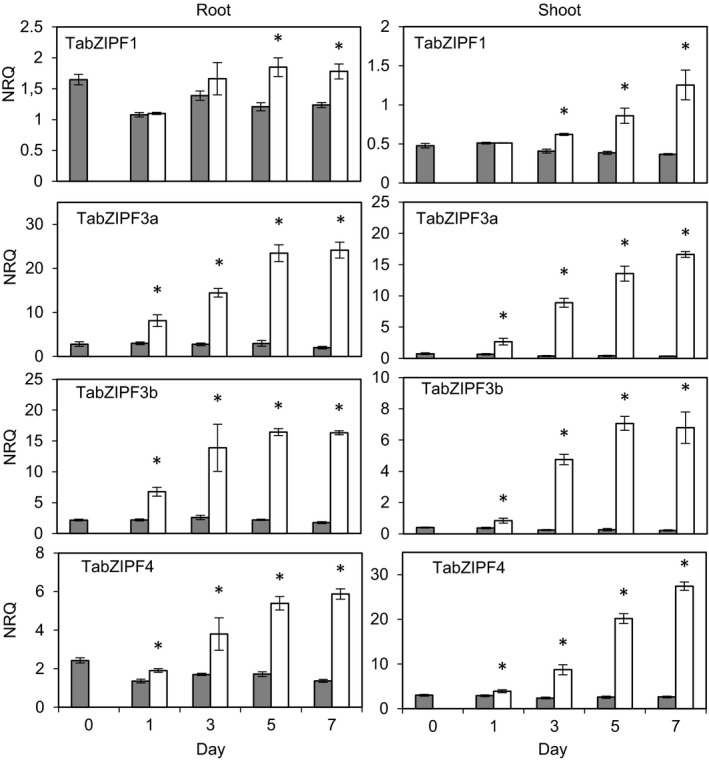
Figure 5.

TabZIP gene expression analysis in wheat material throughout a 1‐week Zn starvation period.
Relative expression levels (normalised relative quantification, NRQ) of five wheat bZIP transcription factor gene transcripts in root and shoot material throughout 1 week of Zn starvation. NRQ values are normalised to TaActin3 and TaSuccDH expression and means of three biological replicates are given (±SEM). Bars within individual graphs displaying an asterisk show a significant difference between treatment means at a given time point. Significance (P < 0.05) was tested post hoc, using Fisher's least significant difference test on log2(1/NRQ)‐transformed data. +Zn = 8 μm Zn (grey bars), −Zn = 0 μm Zn (white bars).
