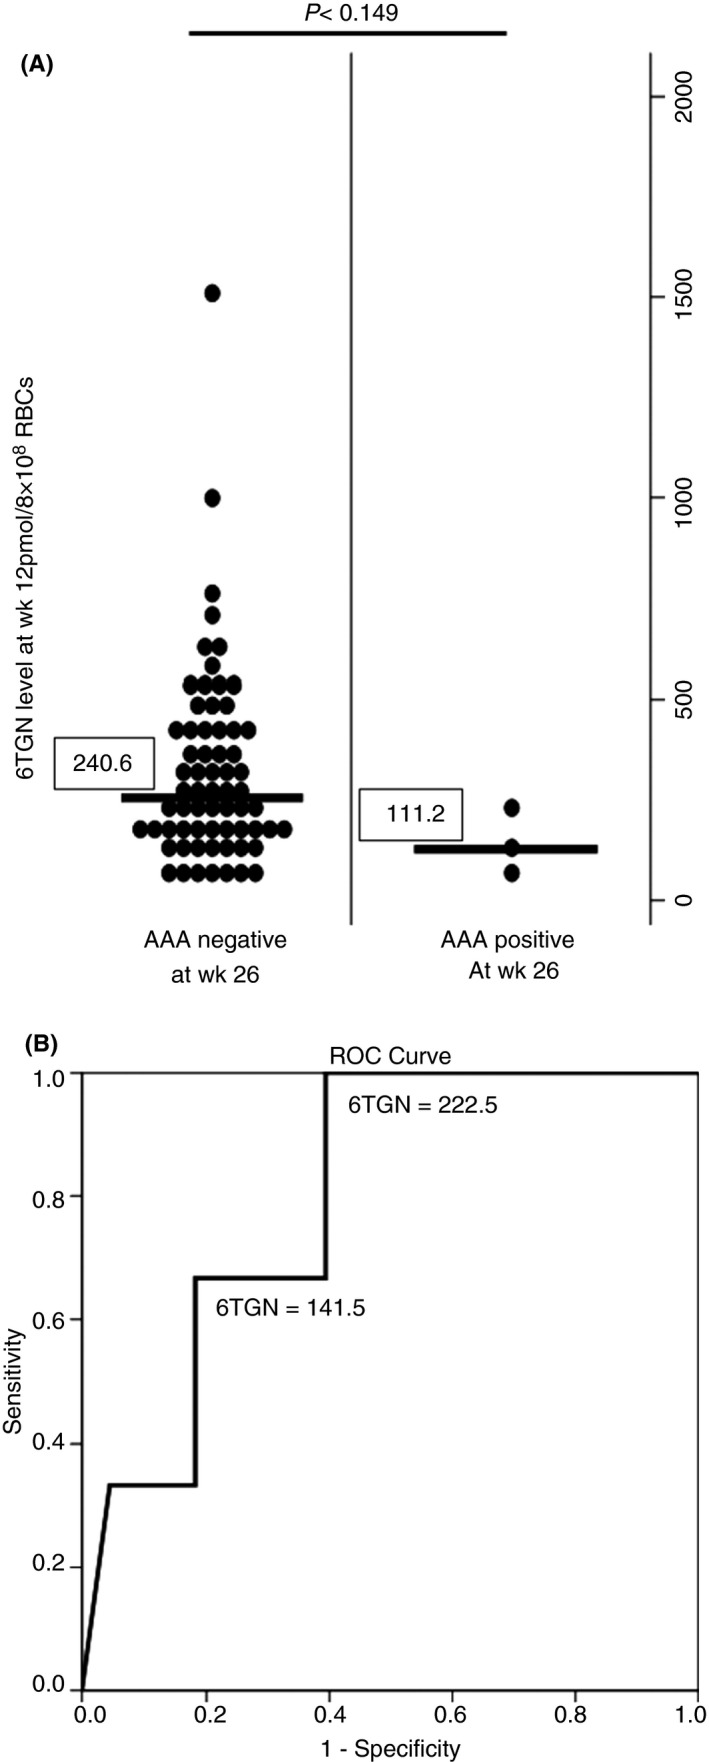
Figure 3.

A, The association between 6‐TGN levels at 12 weeks and AAA positivity. CD patients negative for AAA at week 26 showed a higher 6‐TGN level at week 12 in comparison with those positive for AAA. The vertical line shows geometric data. B, ROC curve of 6‐TGN level at week 12 and development of AAA (AUC [95% CI] 0.801 [0.61‐0.988])
