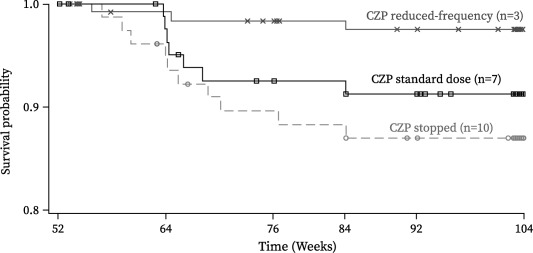
Figure 4.

Kaplan‐Meier plot of time to rheumatoid arthritis (RA) disease flare, showing the full analysis set. Disease flares had to be self‐reported by the patient to the investigator at a study visit; solicitation by the study investigators was not mandated by the protocol. Patients reporting a flare had to meet the following 3 criteria at 2 consecutive visits 2 weeks apart: 1) an increase in the Disease Activity Score in 28 joints using the erythrocyte sedimentation rate (DAS28‐ESR) of ≥0.6 above the DAS28‐ESR at week 52; 2) a DAS28‐ESR of >3.2; and 3) in the investigator's judgment, an increase in the patient's RA activity. Time to flare was defined as the time from the date of the week 52 injection of study medication to the date of the first flare visit for a confirmed flare. Patients who did not have a flare were censored at the date of the latest assessment of the DAS28‐ESR. CZP = certolizumab pegol. See Patients and Methods for descriptions of groups.
