
Figure 2.
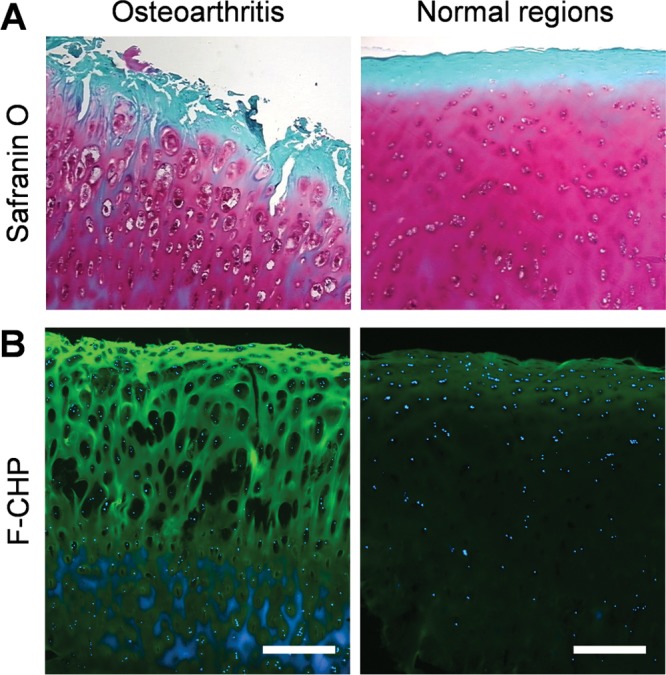
Osteoarthritis. Micrographs of articular cartilage tissue within the osteoarthritic or normal region from an OA patient. Sections from the same tissue samples were stained with Safranin O/fast green (A) or with F-CHP (B). Images of the Safranin O staining (A) were provided by the tissue supplier with permission (Copyright OriGene Technologies). In panel (B), Hoechst 33342-stained cell nuclei are shown in blue, and each image is representative of similar results from three stained sections. Scale bars: 500 μm.