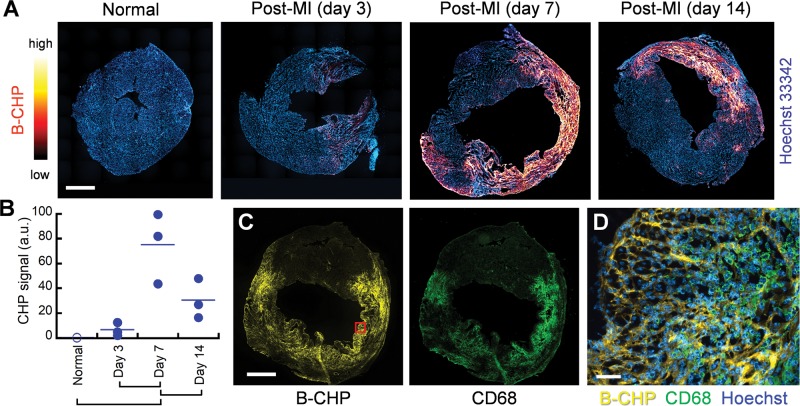
Figure 3.
Myocardial infarction. (A) Representative fluorescence scans of axial cross sections of the mouse hearts before (normal) or at three time points after myocardial infarction (MI), stained with Hoechst 33342 (blue) and B-CHP (detected with AlexaFluor647-streptavidin, red-yellow). (B) Digitally quantified total CHP fluorescence signals in the whole-section scans of the three hearts in each group are shown (a.u. = arbitrary unit). The means of the paired groups labeled under the graph are significantly different (one-way ANOVA with post hoc Tukey HSD test, P < 0.05). (C) Fluorescence scans of a heart harvested 7 days after MI show close spatial similarity between signals from B-CHP and macrophages as detected with an anti-CD68 antibody. (D) A magnified view of the infarcted region within the red box in panel (C) with merged fluorescence signals shows that high level of degraded collagen is in areas crowded with macrophages. Scale bars: 1 mm (A, C), 50 μm (D).

