Figure 5.
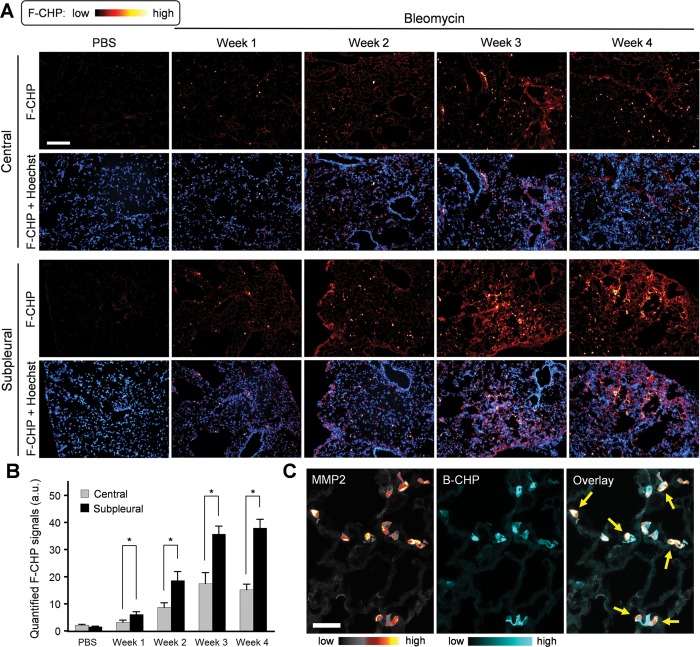
Pulmonary fibrosis. (A) Representative fluorescence micrographs of the central and subpleural areas of lung cryosections obtained from mice dosed with bleomycin through minipumps for varying time periods versus control mice dosed with PBS for 1 week, and stained with F-CHP and Hoechst 33342. Selected micrographs are representative of images collected from 3 animals per group. (B) Quantified signals showing the time course and spatial difference of F-CHP signal levels. Numbers are presented as the mean + standard error and analyzed using one-way ANOVA with post hoc Tukey HSD test. * indicates significant difference in means (P < 0.05). (C) Micrographs showing multiple views of lung tissue harvested from mice treated with bleomycin for 3 weeks. The tissues were double stained with B-CHP and an anti-MMP2 antibody, which were visualized using AlexaFluor647-labeled streptavidin and AlexaFluor555-labeled donkey anti-rabbit IgG H&L, respectively. Yellow arrows mark the locations where high MMP2 signals overlap with decreased CHP signals. Additional examples are provided in Figure S7. Scale bars: 200 μm (A), 50 μm (C).

