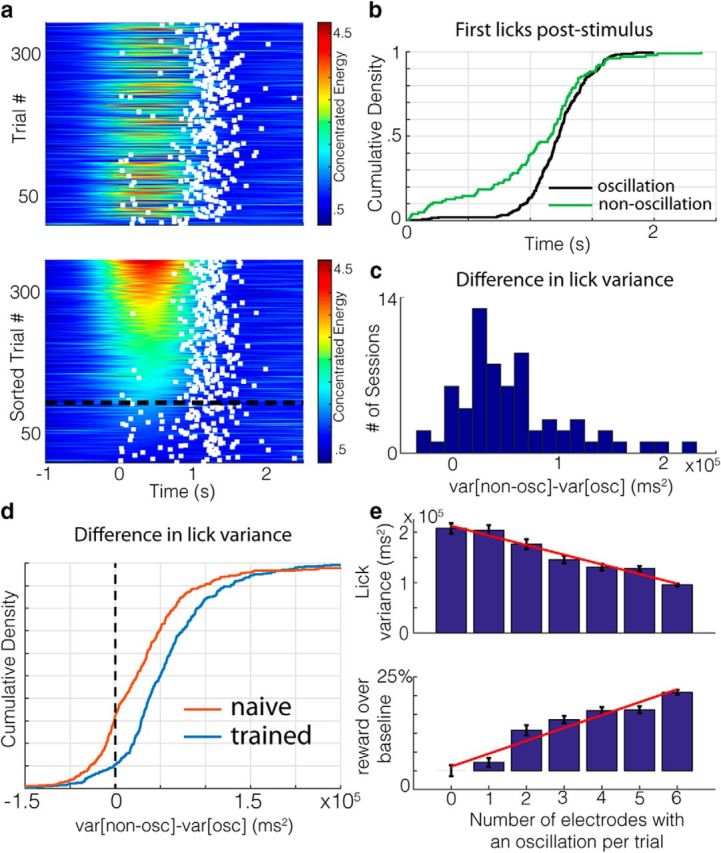
Figure 2.

Wait time precision is higher during oscillatory states. a, Concentrated energy values with first wait times (white squares) poststimulus overlaid for each trial of an example session in chronological order (top) and sorted by oscillation duration (bottom). The dashed black line is the threshold for being categorized as oscillatory. b, Empirical cumulative density functions for the first lick times (wait times) poststimulus on oscillation (black) and nonoscillation (green) trials in a. c, Histogram of the difference in lick variability on oscillation and nonoscillation trials for each session recorded on a given electrode. d, Differences in wait time variability on oscillatory and nonoscillatory trials for all sessions and channels of trained (blue) and naive (red, animals. e, Top, Lick variability decreases as the number of electrodes on which an oscillation was detected increases for a given trial. Standard error bars are shown in black, with the regression line in red. Bottom, Percentage of water obtained over baseline (defined as trials in which no oscillations were detected on any electrodes) increases as the number of electrodes showing an oscillation increases. Standard error bars are shown in black, with the regression line in red.
