
Figure 5.
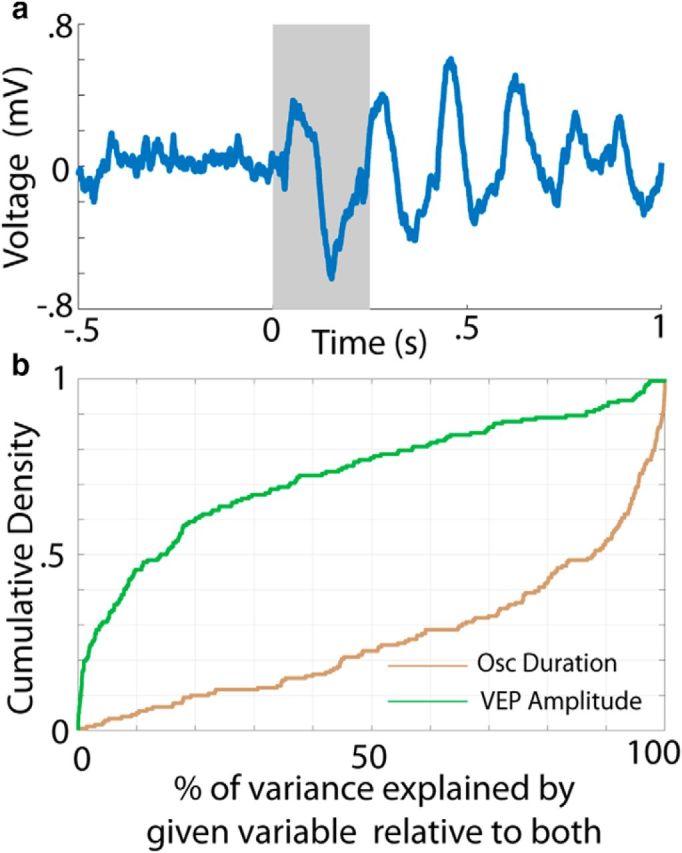
Wait time correlates with oscillation duration across a wide range of metrics and parameters. a, LFP trace from a single trial with a 250 ms gray bar overlaid to highlight the VEP. b, Percentage of variance explained by a regression of wait time against oscillation duration (brown) or VEP amplitude (green) relative to a model containing both variables.