Figure 5.

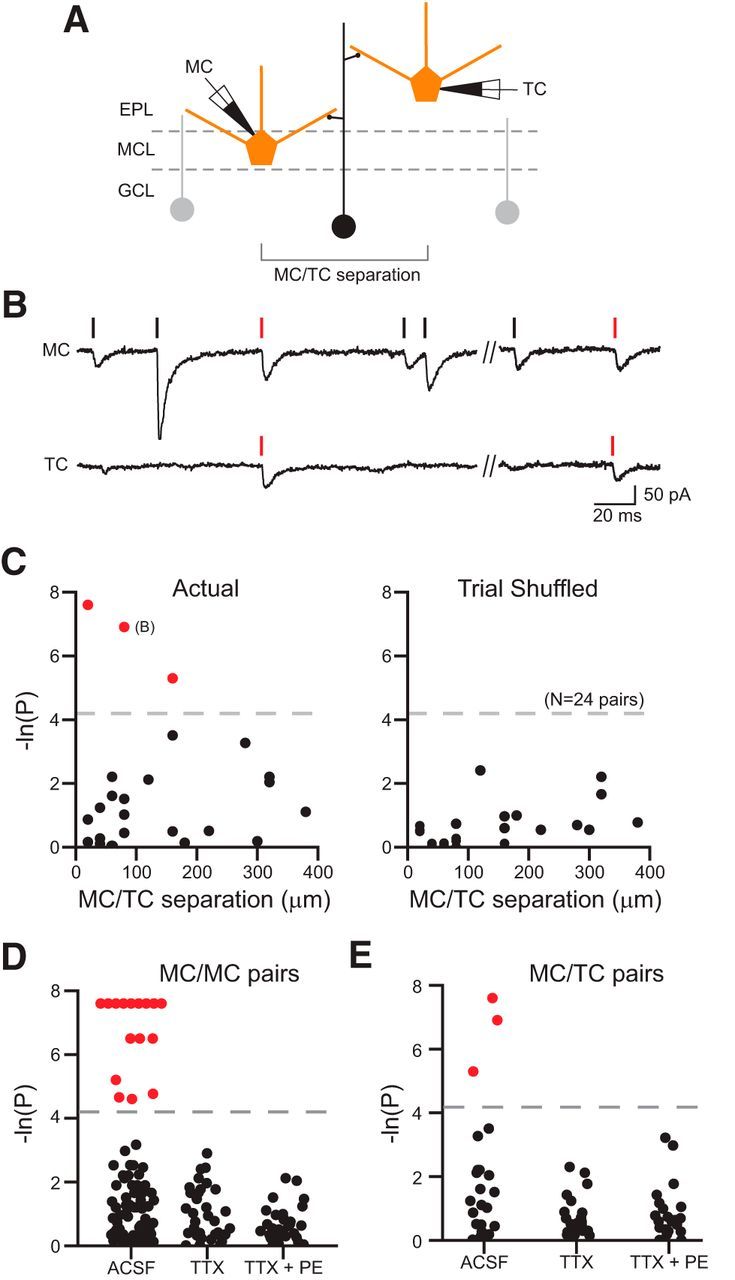
Coincident inhibition in mitral/TC paired recordings. A, Diagram of recording configuration. B, Simultaneous MC (top) and TC (bottom) recording showing near-coincident IPSCs (onset lags: −0.1 and −0.9 ms). C, Plot of the relationship between the degree of inhibitory synchrony and somatic separation in 24 MC/TC paired recordings based on the actual (left) and trial shuffled (right) IPSC onset times. Three experiments with statistically significant inhibitory synchrony (p < 0.015; dashed lines) are denoted by red symbols. The x-axis reflects only the component of the somatic separation along the MCL. D, Plot of the degree of inhibitory synchrony in MC/MC paired recordings assayed in ACSF (N = 89), TTX (N = 43), and TTX + PE (N = 43). Experiments with statistically significant inhibitory synchrony (p < 0.015; dashed line) are denoted by red symbols. E, Similar plot for MC/TC paired recordings (N = 24 experiments in ACSF, N = 22 in TTX and TTX + PE).
