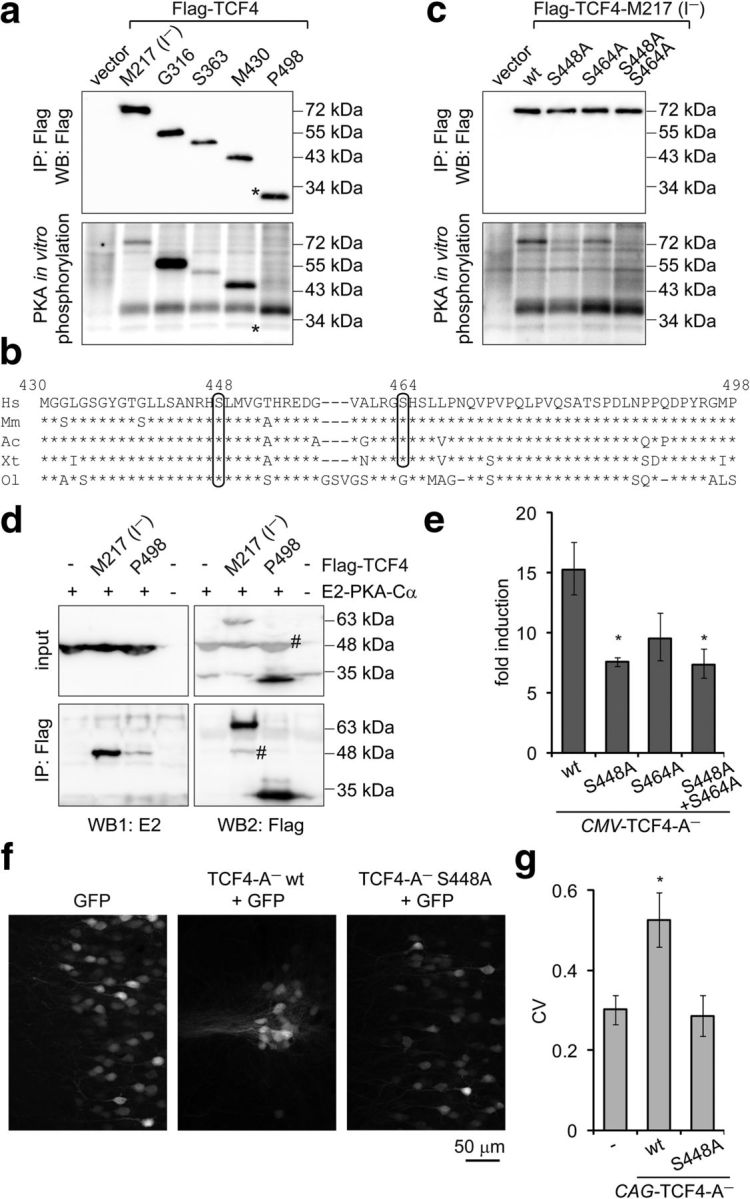
Figure 5.

Identification and functional analysis of PKA phosphorylation sites in TCF4 in vitro and in vivo. a, c, Western blot analysis and in vitro phosphorylation assay with Flag-TCF4-I− deletant (a) and point mutant (c) proteins overexpressed in HEK-293 cells and immunoprecipitated with Flag antibodies. Kinase E2-PKA-Cα was overexpressed in HEK-293 cells and immunoprecipitated with E2 antibodies. The position of Flag-TCF4–P498 is indicated with an asterisk (*). b, Alignment of Homo sapiens (Hs) TCF4 protein region M430–P498 with the respective regions in TCF4 of Mus musculus (Mm), Arolis carolinensis (Ac), Xenopus tropicalis (Xt), and Oryzias latipes (Ol). The predicted PKA phosphorylation sites S448 and S464 are circled. d, Interactions of E2-PKA-Cα with Flag-TCF4. The proteins were overexpressed in HEK-293FT cells as indicated and coimmunoprecipitated with Flag antibodies. Western blots with E2 and Flag antibodies were performed sequentially, the number sign (#) marks bands from previous layer. In a, c, and d, a representative of at least two independent experiments with similar results is shown. e, Reporter assay with primary neurons transfected with firefly luciferase construct carrying 12 μE5 E-boxes in front of TK promoter, Renilla luciferase construct with EF1α promoter, and WT or mutant TCF4-A− encoding constructs. Data are presented as fold induction of luciferase activity in 25 mm KCl-treated neurons compared with untreated neurons. f, Distribution of layer 2/3 pyramidal neurons expressing TCF4 and/or GFP protein in the mPFC. Rat embryos were electroporated in utero at E16 and coronal sections from P21 animals were subjected to confocal microscopy. g, Quantification of the data in f. Pixel intensities perpendicular to the medial surface were binned and the CV across all bins was calculated. The higher the CV value, the more clustered is the distribution of cells. Results from four (e) or seven (f, g; except for GFP, which is n = 4) independent experiments are shown. Error bars indicate SEM. *p < 0.05; one-way ANOVA followed by Dunnett's post hoc tests for comparisons with WT (e) or control GFP (g).
