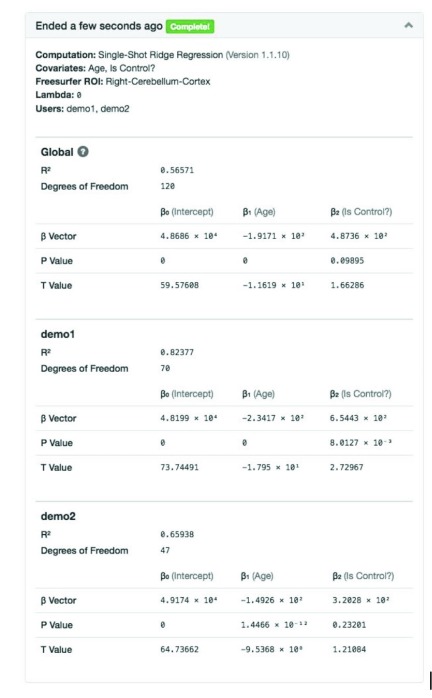
Figure 14. Example statistical output table for ridge regression.
This output is generated using simulated freesurfer brain volume data. In the simulation, the intercept part (β 0) was set to a fixed amount (48466.3 for Right-Cerebellum-Cortex); the age effect(β 1) was selected randomly from range [-300, -100] and group(isControl) effect(β 2) was selected randomly from range [500, 1000] for each pseudo subject; the standard unit Gaussian noise multiplied by random index ranged from 1800 to 2200 was added subsequently.

