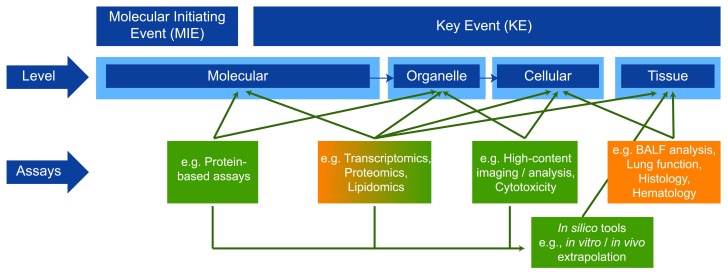
Figure 8. Schematic of an AOP.
The schematic includes biological assays to test the molecular initiating event and specific key events on different levels, which could be combined into a weight of evidence supporting risk assessment or integrated testing strategies. The in vivo tests (orange) should be increasingly replaced by a combination of in vitro assays and in silico tools (green) to reduce animal testing according to the 3Rs principle 26.

