Fig. 4.

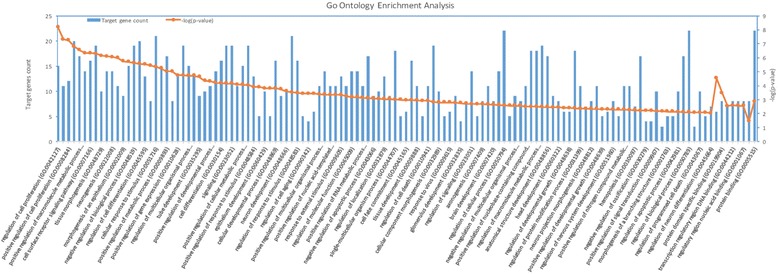
Gene Ontology Enrichment Analysis. X-axis represents each category of molecular functions and biological processes. Y-axis on the left denotes the target gene counts for each category and y-axis on the right denotes –log (p-value) values

Gene Ontology Enrichment Analysis. X-axis represents each category of molecular functions and biological processes. Y-axis on the left denotes the target gene counts for each category and y-axis on the right denotes –log (p-value) values