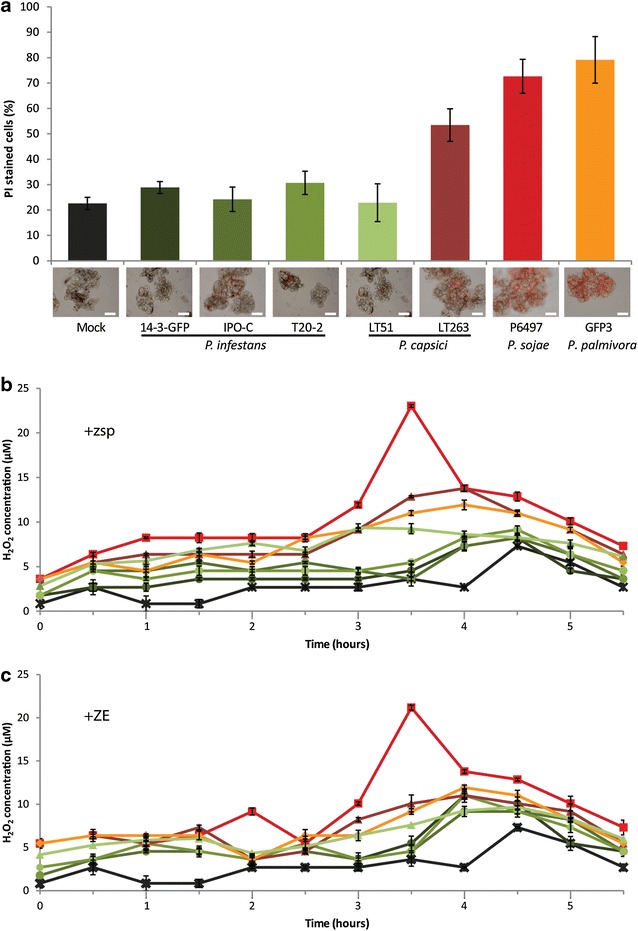
Fig. 2.

Responses of MsK8 cells to inoculation with different Phytophthora spp. and strains. a Percentage of MsK8 cells in suspension showing cell death at 16 hpi. Cell death was quantified by counting the cells stained with propidium iodine (PI), as shown in the microscopy images, and the total number of cells (set at 100%). Bars represent 200 μm. b, c ROS production by MsK8 cells measured at different time points (X-axis) after b inoculation with Phytophthora zoospores or c after treatment with zoospore exudate (ZE). ROS production was quantified by measuring the H2O2 concentration with the xylenol orange assay. Colors of the bars (a) and lines (b, c) correspond to a specific strain and species as indicated in a. Error bars represent standard deviation (n = 3)
