
Fig. 3.
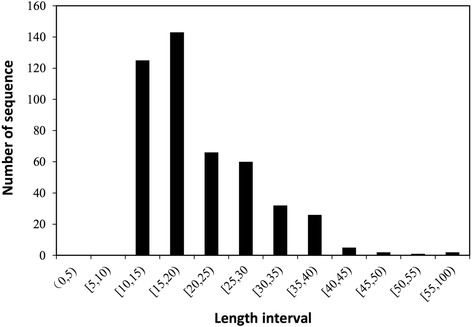
Distribution of true CPPs in the positive set. The x-axis denotes the length interval of the CPPs. For example, the interval (0, 5) denotes that the CPP is 1–4 amino acids long (greater than 0 and less than 5), whereas [5, 10] indicates a CPP length from 5 to 9 (greater than or equal to 5 and less than 10). The y-axis denotes the number of sequences (CPPs)