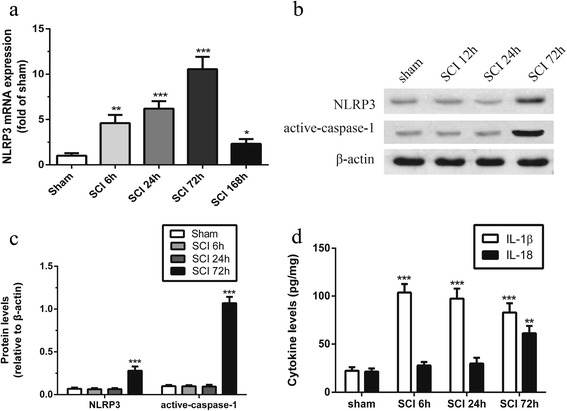
Fig. 1.

Time course of NLRP3 expression in spinal cord tissue after SCI. a Time course of NLRP3 expression during 7 days post-SCI analyzed by qPCR. b, c Representative western blots and quantification analysis of NLRP3 and active-caspase-1 during 3 days post-SCI. d Time course of interleukin (IL)-1β and IL-18 levels during 7 days post-SCI analyzed by ELISA. *p < 0.05, **p < 0.01, ***p < 0.001. Data represent means ± SEM, n = 5
