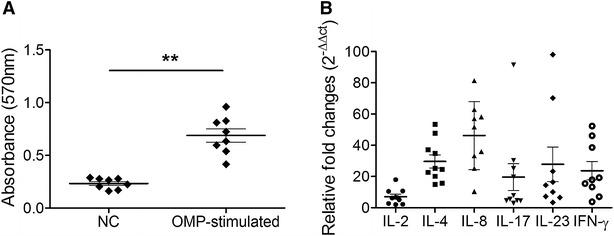
Figure 5.

T-cell immune responses elicited by JOL1950 immunization. A Splenocyte proliferative responses against the OMP fraction in immunized (group A, n = 5) mice and non-immunized (group B = 5) mice which were used as a negative control (NC) at week 2 pi determined by absorbance values at 570 nm using the MTT assay. B Relative quantification (2−∆∆Ct) of cytokine mRNA levels in in vitro-stimulated splenic T cells isolated from mice in the immunized group. Data are presented as scatter plots and mean ± SE of five individual values in duplicate. **P < 0.001 (vs. restimulated NC).
