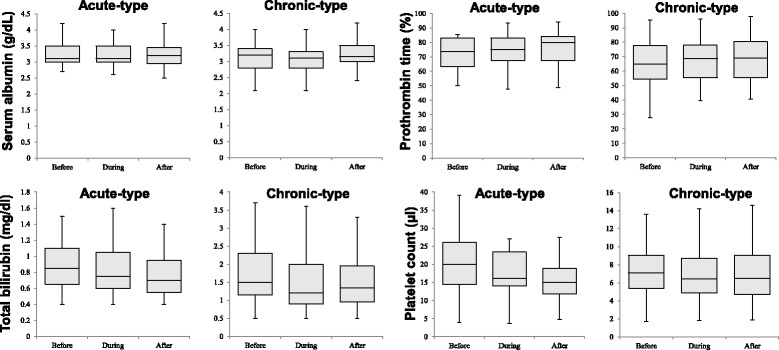
Fig. 5.

Effect of treatment with danaparoid sodium on serum albumin, total bilirubin, prothrombin time, and platelet count. No treatment-related significant changes were observed in these parameters. In these plots, lines within the boxes represent median values; the upper and lower lines of the boxes represent the 25th and 75th percentiles, respectively; and the upper and lower bars outside the boxes represent the 90th and 10th percentiles, respectively
