
Figure 2.
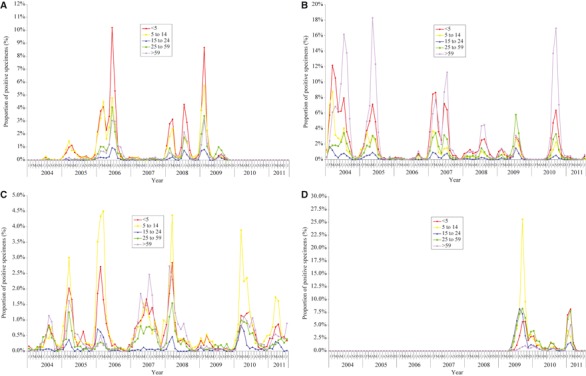
(A) The proportion of specimens positive for influenza A (H1N1) virus by age groups. (B) The proportion of specimens positive for influenza A (H3N2) virus by age groups. (C) The proportion of specimens positive for influenza B virus by age groups. (D) The proportion of specimens positive for pandemic influenza A (H1N1) 2009 virus by age groups.