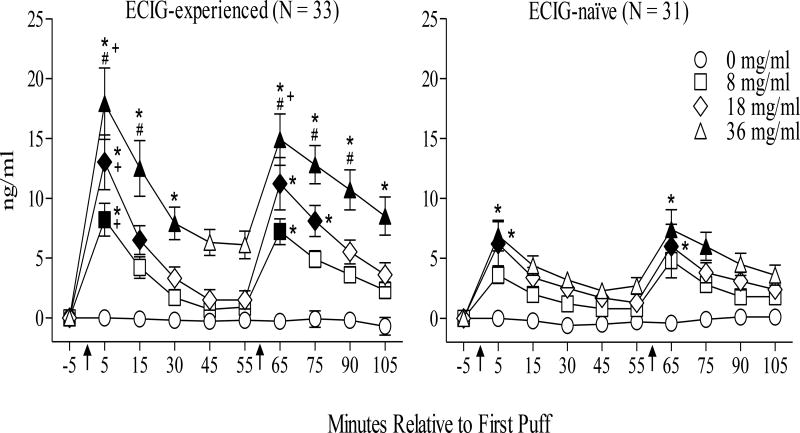
Figure 1.
Mean ± plasma nicotine boost for 33 ECIG-experienced and 31 ECIG-naïve participants. Arrows indicate the onset of each 10-puff ECIG-use bout (30 sec IPI). Filled symbols indicate significant difference from baseline (−5 time point), asterisks (*) indicate significant differences from the 0 mg/ml condition at that time point and pound (#) symbols indicate significant differences between the 8 and 36 mg/ml condition at that timepoint (ps < .05; Tukey’s HSD). Plus signs (+) indicate significant between group differences at that time point for that concentration (only conducted on timepoints immediately post-bout; independent t-tests; ps < .05).

