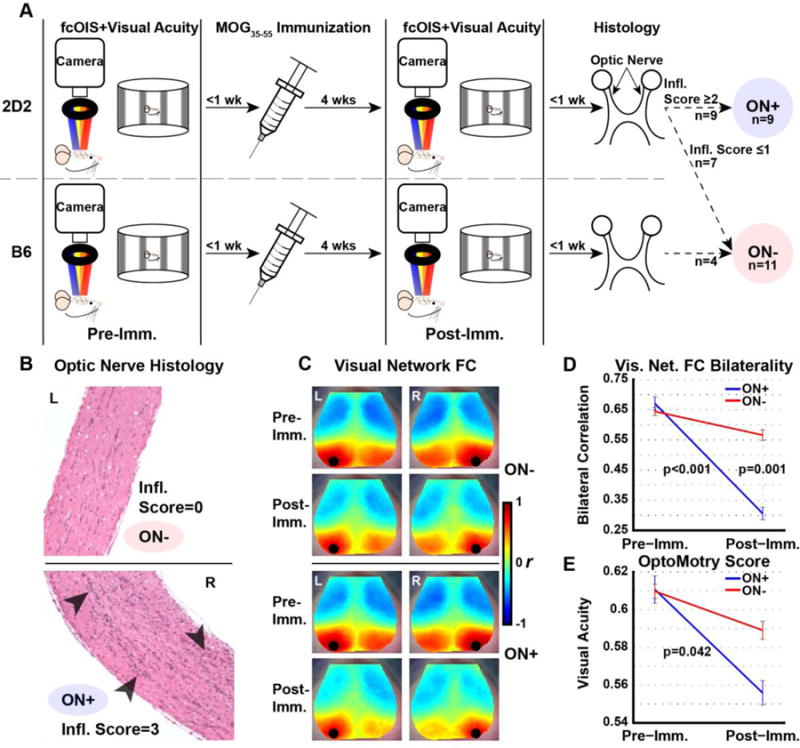
Figure 1. Altered FC over time in a murine model of ON.

(A) Experimental design consisting of a baseline OptoMotry and fcOIS session, immunization with MOG35–55, and a second OptoMotry and fcOIS session for all 2D2 and B6 mice included in the study. Subsequently, optic nerves were harvested and scored for extent of inflammation to determine ON status. (B) Representative images from an unaffected optic nerve (inflammation score = 0, top) and with inflammatory infiltrates categorized as ON (inflammation score = 3, bottom). (C) Seed-based homotopic FC maps of visual, motor, and retrosplenial networks for the unaffected (WT+2D2) and ON groups at pre- and post-immunization time points. (D) Significant longitudinal reduction (p<0.001) in FC bilaterality in the visual network that was also significantly lower (p = 0.001) cross-sectionally in ON+ compared to ON− at the post-immunization timepoint. (E) Longitudinal group-wise OptoMotry performance scores are significantly reduced (p<0.05) in the ON+ group (n=9) but not in ON− mice (n=11).
