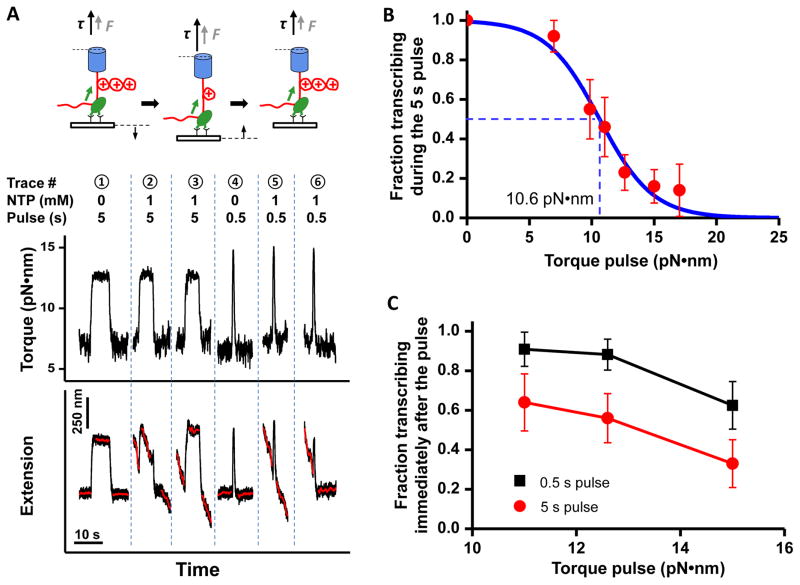
Figure 3. Transcription response to a transient torque pulse.
(A) (Top) A cartoon illustrating steps of the “torque pulse” experiments and (Bottom) representative traces of data. RNAP initially transcribed under a low downstream torque of approximately +7 pN•nm, and then was subjected to a higher torque pulse for either 5 s or 0.5 s before restoration of the initial low torque. Traces 1 and 4 are controls. The extension and time axes are shifted for clarity.
(B) The probability of maintaining active transcription during the 5 s torque pulse. The blue solid line is a fit to a Boltzmann function): f = 1/[1+e(τ−τc)/τ0], where τc is the characteristic cutoff torque.
(C) The probability of resuming transcription immediately (within 5 s) after the torque pulse.

