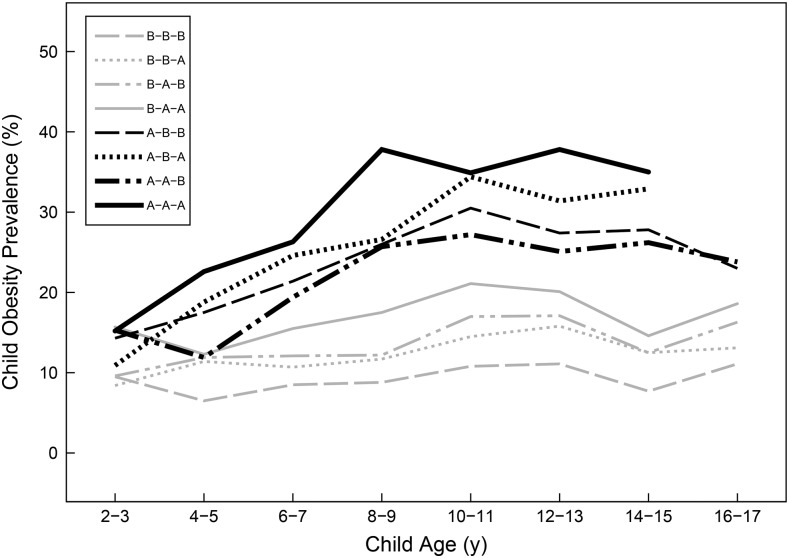
FIGURE 2.
Prevalence of child obesity across ages and stratified by recommendation-based maternal weight trajectory groups. The key indicates women who were classified as “below” or “above” (denoted as B or A, respectively) the cutoff at each maternal weight time point (prepregnancy, delivery, and postpartum). “Above” status was defined as follows: prepregnancy, BMI (in kg/m2) ≥25; at delivery, gestational weight gain in excess of the Institute of Medicine recommendations; and postpartum, weight retention ≥5 kg. Data are not shown for cell sizes <30.

