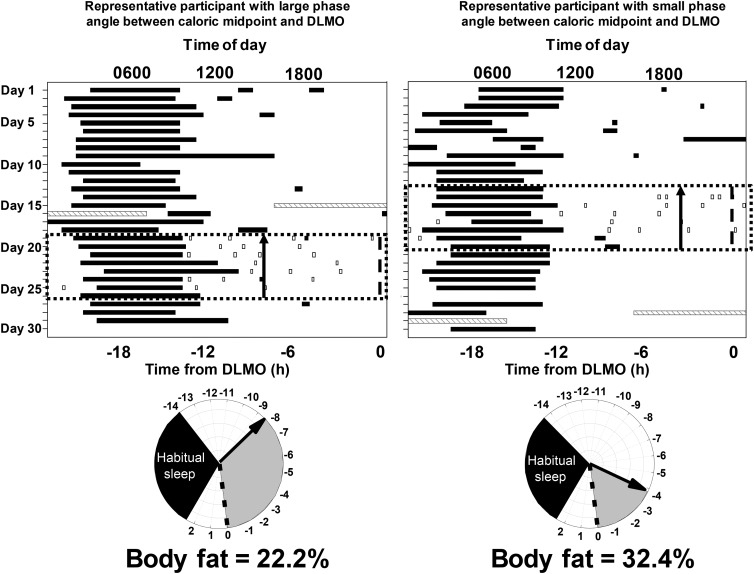
FIGURE 1.
Raster plots (top) of the ∼30-d protocol from 2 participants: 1 with a large phase angle (time difference) between caloric midpoint (average time at which 50% of daily calories were consumed) and DLMO timing (left) and 1 with a small phase angle between caloric midpoint and DLMO timing (right). The x-axis represents the time of day, and the y-axis represents days into the protocol. The black bars represent sleep episodes, gray hatched bars represent the in-laboratory overnight stay for recording percentage of body fat and a DLMO phase assessment (light <4 lux), the black dotted box represents the week of monitoring caloric intake via the time-stamped mobile phone picture food diary, and the open boxes represent caloric events (i.e., any food or beverage that is not water). Note that the in-laboratory assessment could occur before or after the week of monitoring caloric intake but was during the ∼30 d of the protocol. The black arrow on the top and bottom panels denotes the timing of caloric midpoint relative to DLMO. Relative timing of physiologic events in the 2 participants (bottom). The dotted line is the timing of the DLMO, the gray shaded area denotes the phase angle, and the black shaded area denotes habitual sleep timing for that participant relative to DLMO. DLMO, dim-light melatonin onset.

