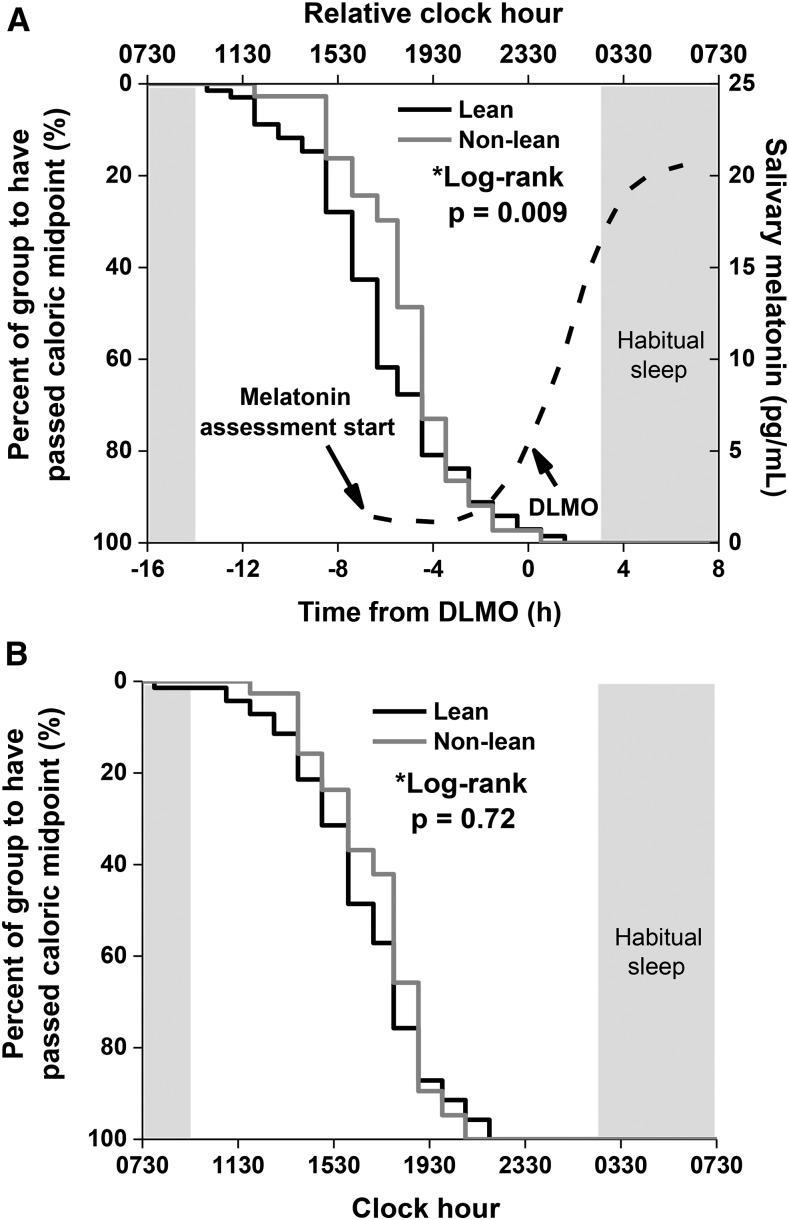
FIGURE 2.
Kaplan-Meier survival curves of lean (n = 67; black line) and nonlean (n = 39; gray line) participants’ time to pass caloric midpoint (average time at which 50% of daily calories were consumed) relative to DLMO (A) and clock hour (B). Lean and nonlean participants were defined by their percentage of body fat and by sex (32). The dashed curve and corresponding right y axis represent the average melatonin concentrations of all participants, and the shaded box represents the average habitual timing of sleep of the whole population. P values were derived from log-rank tests. DLMO, dim-light melatonin onset.

