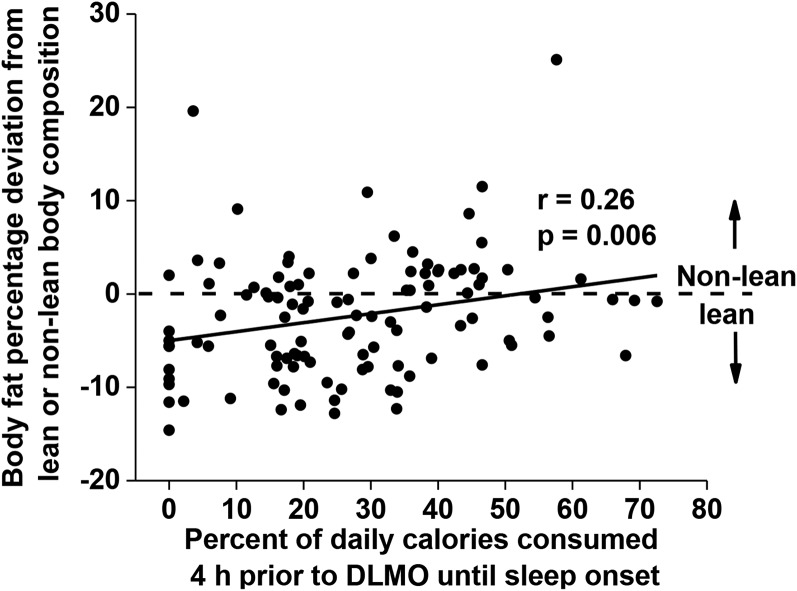
FIGURE 3.
Correlation between the percentage of calories consumed between 4 h before DLMO and sleep onset (x-axis) and body fat percentage represented as a deviation from the sex-specific criteria of lean (n = 67) or nonlean (n = 39) body composition (y-axis). The horizontal dashed line at 0 represents the threshold to be categorized as lean (<0) or nonlean (>0). Data were analyzed with the Pearson correlation. DLMO, dim-light melatonin onset.

