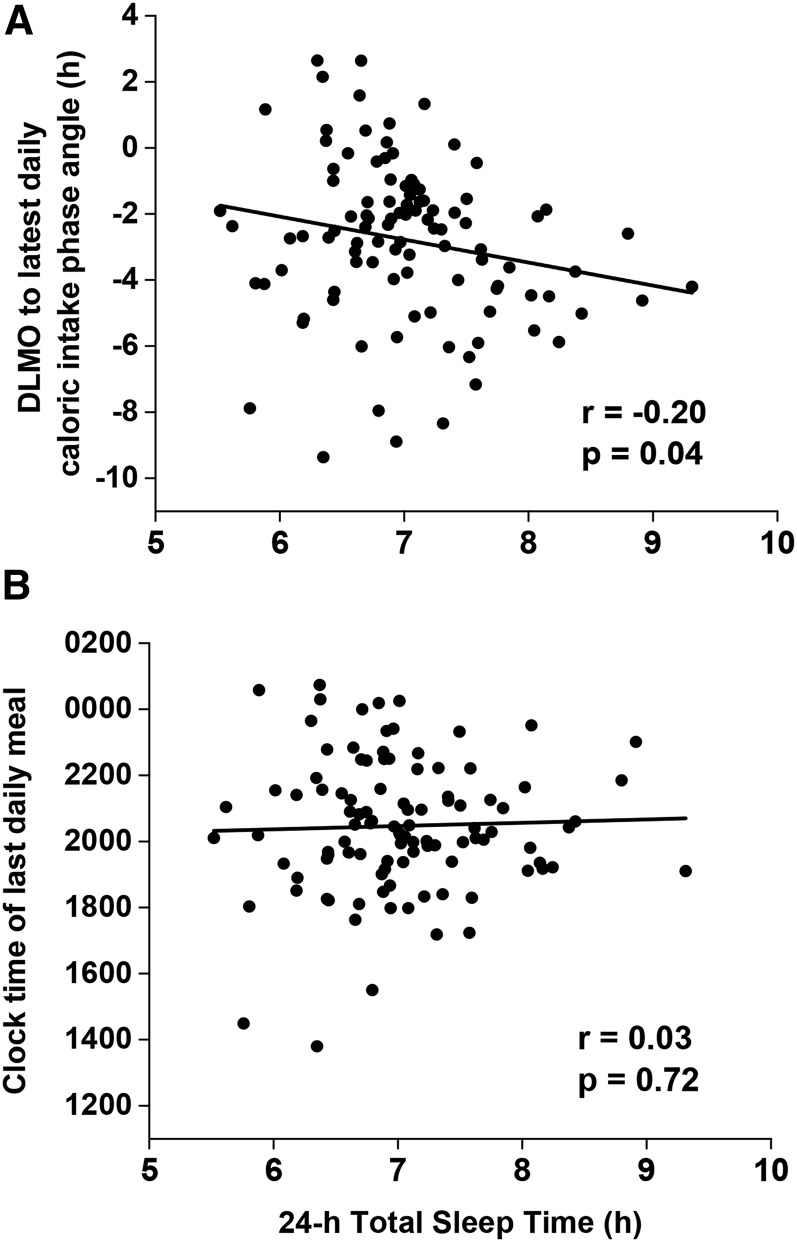
FIGURE 4.
Correlations between 24-h total sleep time (x-axis) and the time difference of the latest daily calories relative to DLMO timing (i.e., time of latest calories minus DLMO) represented as phase angle (n = 100) (y-axis) (A) and clock hour of the latest daily calories (n = 104) (y-axis) (B). Data were analyzed with the Pearson correlation. DLMO, dim-light melatonin onset.

