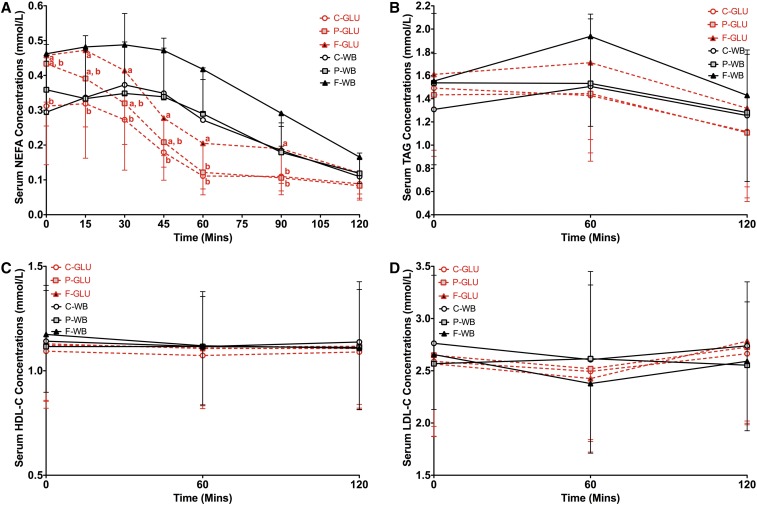
FIGURE 4.
Mean ± SD effects of different breakfasts on postprandial serum NEFA, TAG, HDL-C, and LDL-C responses to the glucose-drink and white-bread challenges. Serum NEFA (A), TAG (B), HDL-C (C), and LDL-C (D) concentrations after glucose-drink and white-bread challenges preceded by breakfasts varying in macronutrient composition are presented. Differences in serum postprandial NEFA, TAG, HDL-cholesterol, and LDL-cholesterol concentrations between breakfasts over a 2-h test period were determined with the use of a 2-factor mixed ANOVA with the main effects of the test breakfast and time and test breakfast × time interaction with repeated measures for participants after intakes of the glucose drink and white bread, respectively. P values for the breakfast × time interaction after intake of the glucose drink were P = 0.0216, P = 0.91, P = 0.99, and P = 0.53 for NEFA, TAG, HDL-C, and LDL-C, respectively. P values for the breakfast × time interaction after white-bread intake were P = 0.78, P = 0.30, P = 0.40, and P = 0.31 for NEFA, TAG, HDL-C, and LDL-C, respectively. Because the breakfast × time interaction for NEFA after glucose-drink intake was significant at P ≤ 0.05, multiple comparisons at each time point were carried out via the Tukey-Kramer method. Significance was accepted at P ≤ 0.05. Means with different letters are significantly different from each other at the same time point. n = 20. C-GLU, carbohydrate, glucose drink; C-WB, carbohydrate, white bread; F-GLU, fat, glucose drink; F-WB, fat, white bread; HDL-C, HDL cholesterol; LDL-C, LDL cholesterol; NEFA, nonesterified fatty acid; P-GLU, protein, glucose drink; P-WB, protein, white bread; TAG, triacylglycerol.

