Figure 2.
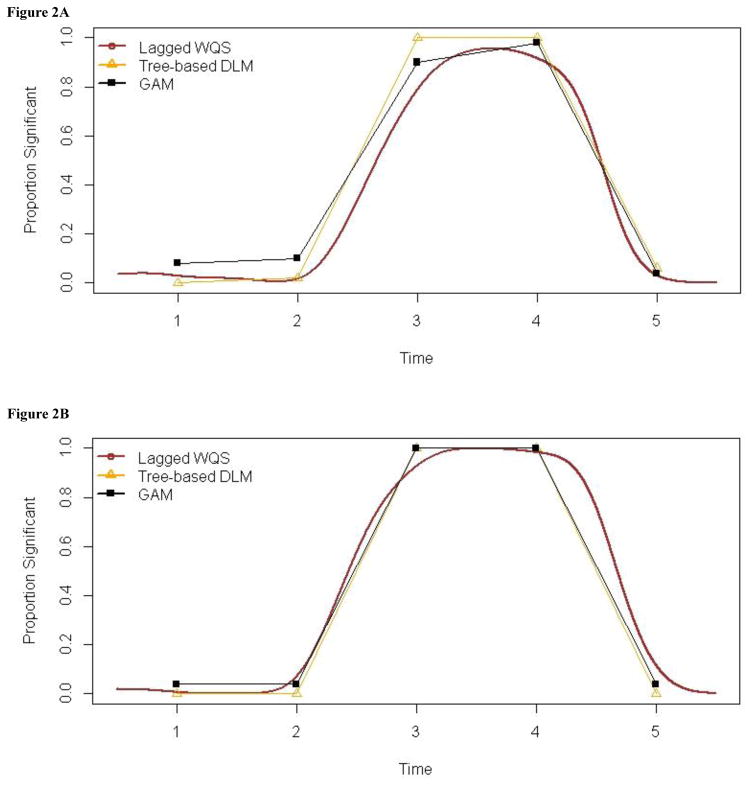
Figure 2A: Summary of simulation results for SNR=0.5. The plot shows, for each time point, the proportion of simulated datasets wherein significant mixture effects were found.
Figure 2B. Summary of simulation results for SNR=1.0. The plot shows, for each time point, the proportion of simulated datasets wherein significant mixture effects were found.

