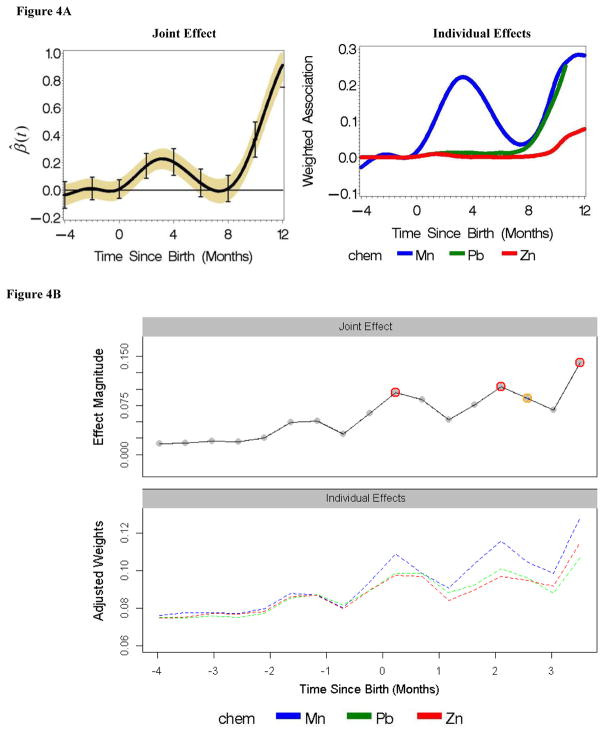
Figure 4.
Figure 4A. Lagged WQS: Time-varying joint/mixture and individual effects of Mn, Pb and Zn on behavioral outcome. On the first plot, the y-axis represents the time-varying coefficient of the mixture effect. Yellow: 95% CIs unadjusted for multiple testing, adjusted for intra-subject correlations; bars: Holm-Bonferroni adjustment for multiple testing
Figure 4B. Tree-based DLMs - Time-varying individual and joint/mixture effects of Mn, Pb and Zn on neuro-behavioral outcome. In the upper panel, time windows with significant mixture/joint effects are denoted by red circles. Orange circles denote marginally significant (at the 10% significance level) mixture effects. The lower panel plot shows the contributions of each chemical over time.

