. 2015 Mar 17;6(5):3129–3138. doi: 10.1039/c5sc00704f

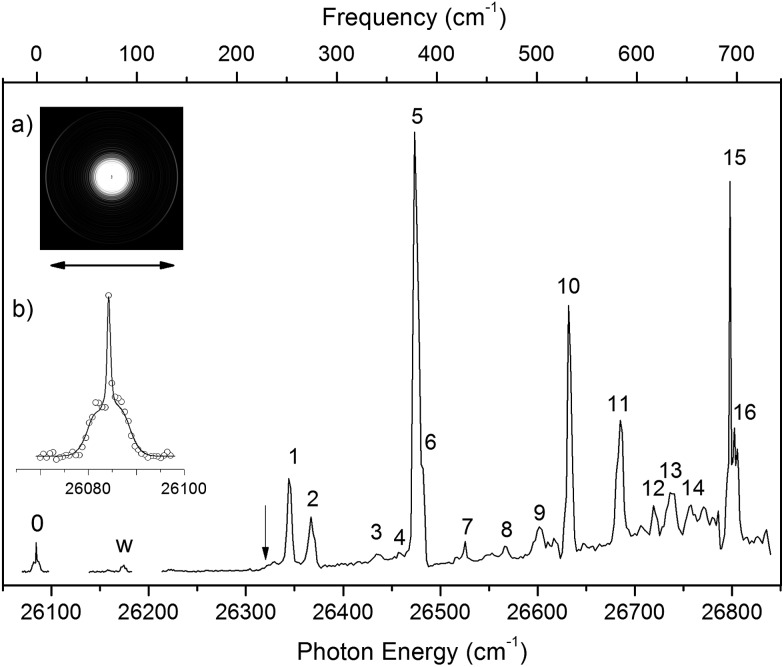
Fig. 3. The photodetachment spectrum of N1[T–H] obtained by measuring the total electron yield as a function of laser wavelength across the detachment threshold. The arrow at 26 322 cm–1 indicates the detachment threshold. The peaks labeled as 1–16 are due to autodetachment from vibrational levels of the DBS of N1[T–H] while the peaks labeled as 0 and w are due to single-color resonant two-photon detachment. Peak 0 at 26 084 cm–1 represents the dipole-bound ground state, corresponding to the outer ring of the photoelectron image in inset (a). The double arrow below the image indicates the direction of the laser polarization. Inset (b) shows a rotational simulation for the 0 peak (c-type) with a rotational temperature of 35 K (dot: experimental data; line: simulation).

Fig. 3