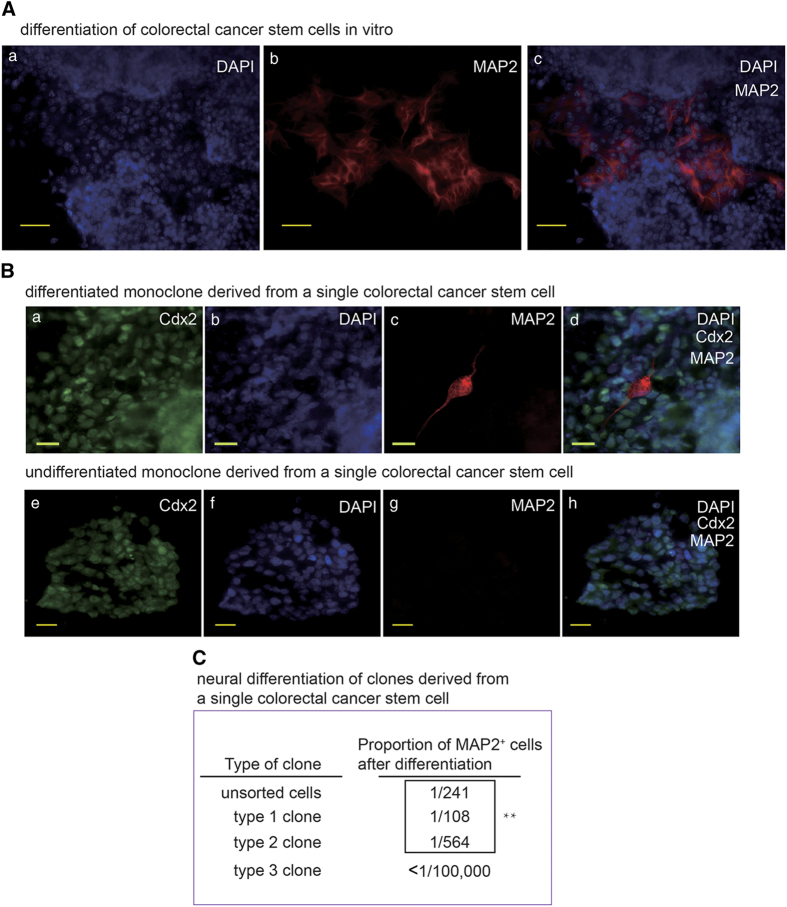
Figure 2.
Monoclonal human gastric and colorectal cancer stem cells produce neural cells. (A) IF staining of MAP2 in in vitro differentiated colorectal cancer stem cell with the scale bar representing 50 μm. (B) a–d: IF staining of colorectal cancer marker Caudal Type Homeobox 2 (CDX2) and MAP2 in in vitro differentiated colorectal cancer stem cell with the scale bar representing 20 μm. Cells were from a clone derived from a single colorectal cancer stem cell. e–h: IF staining of colorectal cancer marker CDX2 and MAP2 in undifferentiated colorectal cancer stem cell sphere frozen section with the scale bar representing 20 μm. Cells were from a clone derived from a single colorectal cancer stem cell. (C) Counting results of proportion of MAP2+ cell in unsorted colorectal cancer stem cells and 3 colorectal cancer stem cell derived monoclones in vitro differentiated for 10 days. Positive cell numbers and total cell numbers from five random fields (except for type 3 monoclone because this type almost didn’t produce any MAP2+ cell.) were quantified with a Carl Zeiss Axio Scope.A1 microscope under ×20 magnification, by counting cells on 30–50% of one field area and extrapolate to 100% of the field. **P<0.01 by one-way analysis of variance test.

