Figure 6.
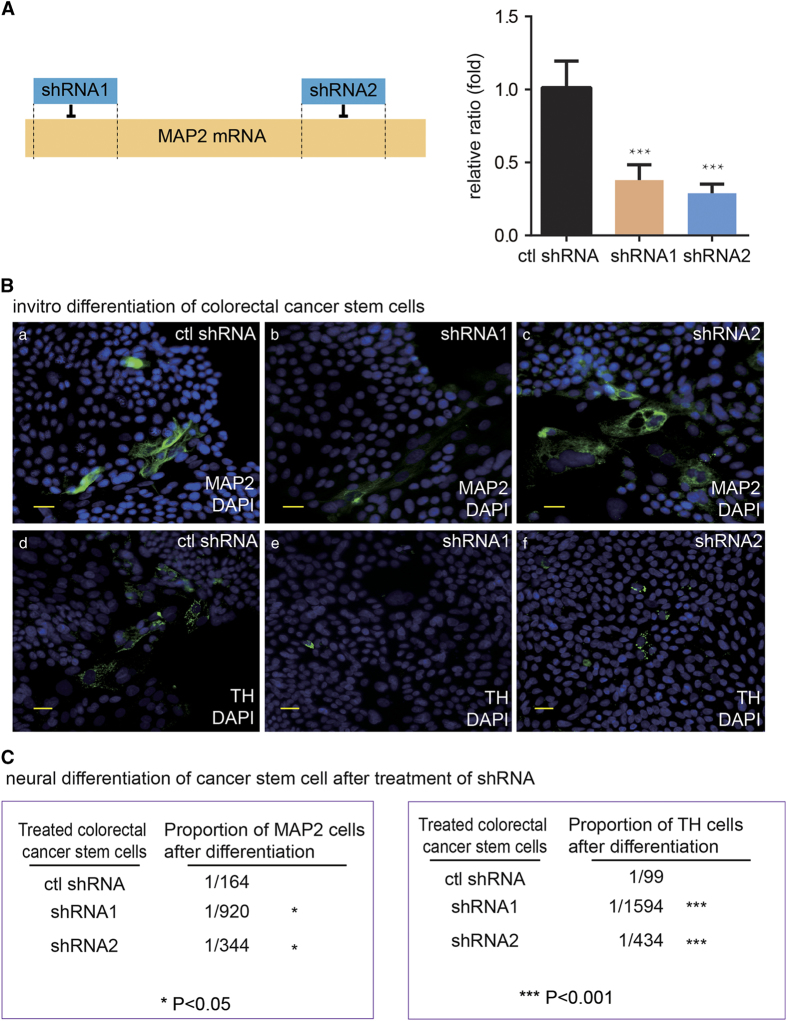
The knocking down of MAP2 expression significantly decreased the generation of neural cells from human gastric and colorectal cancer stem cells. (A) Schematic diagram of 2 MAP2-targeting shRNAs loci in MAP2 gene and shRNA efficiency verified by qRT-PCR. Value represent mean±s.d. of independent biological triplicates. ***P<0.001 by Student’s t-test. (B) a–c: IF staining of MAP2 in in vitro differentiated colorectal cancer stem cell expressing control shRNA, MAP2 shRNA1 and MAP2 shRNA2, respectively, with the scale bar representing 20 μm. Cells were from a single colorectal cancer stem cell. d–f: IF staining of TH in in vitro differentiated colorectal cancer stem cell expressing control shRNA, MAP2 shRNA1 and MAP2 shRNA2, respectively. Cells were from a single colorectal cancer stem cell. (C) Counting results of proportion of MAP2+ cell and TH+ cell in colorectal cancer stem cells expressing control shRNA, MAP2 shRNA1 and MAP2 shRNA2, respectively. Positive cell numbers and total cell numbers from five random fields were quantified with a Carl Zeiss Axio Scope.A1 microscope under ×20 magnification, by counting cells on 30–50% of one field area and extrapolate to 100% of the field. Mean values of calculated cell proportion were shown in the figure. *P<0.05, ***P<0.001 by Student’s t-test.

