
Figure 5. The liver clock modulates transporter expression.
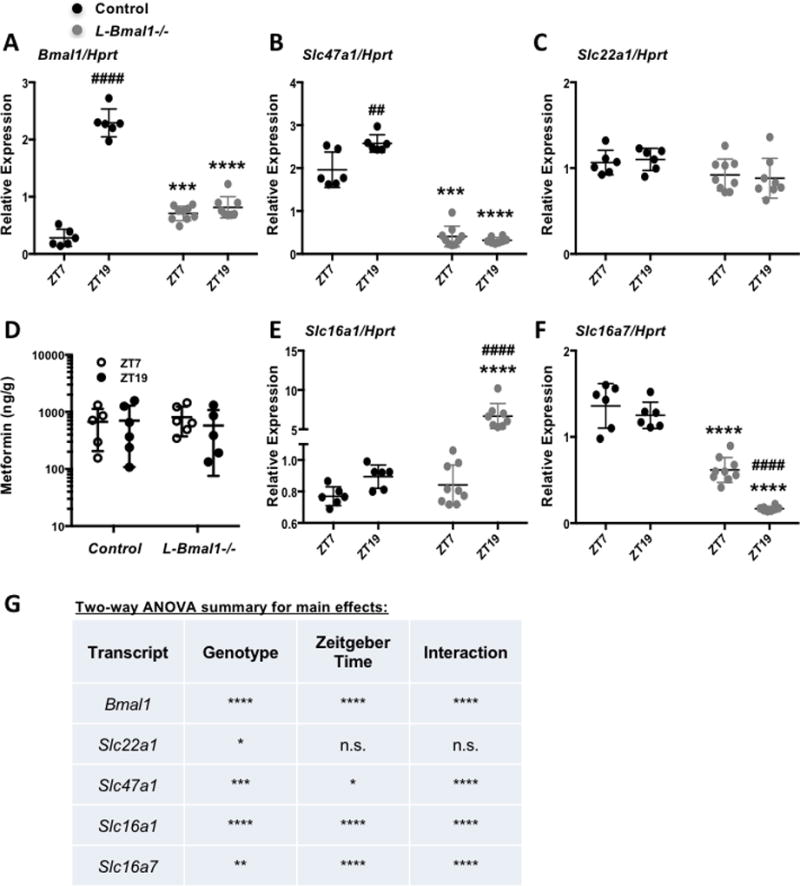
mRNA expression of Bmal1 (A), Slc47a1 (B), Slc22a1 (C), Slc16a1 (E) and Slc16a7 (F) detected by qPCR in mouse livers collected at the indicated ZTs. N=6–9 samples per condition. *** P < 0.001, **** P < 0.0001 vs. control; ## P < 0.01, #### P < 0.0001 vs. ZT7 by post-hoc testing corrected for multiple comparisons. (D) Metformin detected by mass spectrometry in control and L-Bmal1−/− mouse livers snap frozen in liquid nitrogen 20 minutes after intraperitoneal injection with metformin. (G) Results of two-way ANOVA analyses of gene expression data presented in (A–C, E–F). * P < 0.05, ** P < 0.01, ** P < 0.001, **** P < 0.0001 for an effect of genotype, Zeitgeber Time, or interaction between the two as indicated.