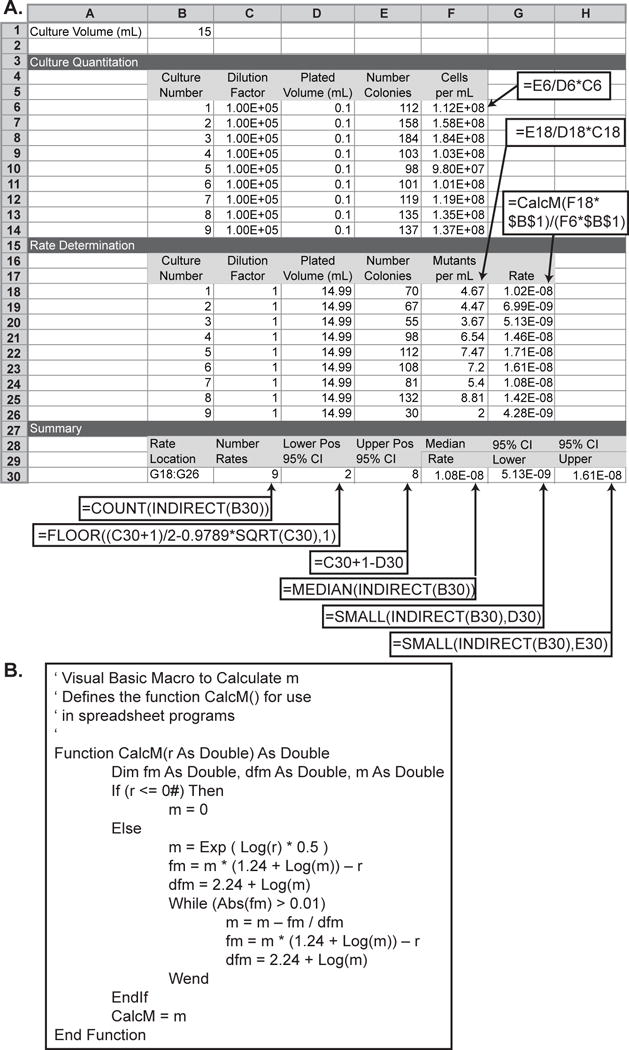
Figure 2. Spreadsheet for calculating the median GCR rate of a series of cultures and 95% confidence intervals for the median GCR rate.

A. The spreadsheet is displayed with both sample data and the underlying formulas. Callout boxes indicate cells that should contain formulas; the required formulas are indicated the callout boxes. For cells F6 to F14, F18 to F26, and G18 to G26, the row specifiers in the formula should be incremented in each row (for example F6 should have the formula =E6/D6*C6 and F7 should have the formula =E7/D7*C7). Most modern spreadsheets have fill functions that will automatically increment these values. B. In order to calculate the rate in cells G18 to G26, the CalcM() Visual Basic macro must be defined for the spreadsheet. CalcM() initializes the test value for m to the square root of r and uses the iterative Newton-Raphson method to solve the transcendental equation r/m − ln(m) − 1.24 = 0. This macro functions in both Microsoft Excel and in LibreOffice Calc.
