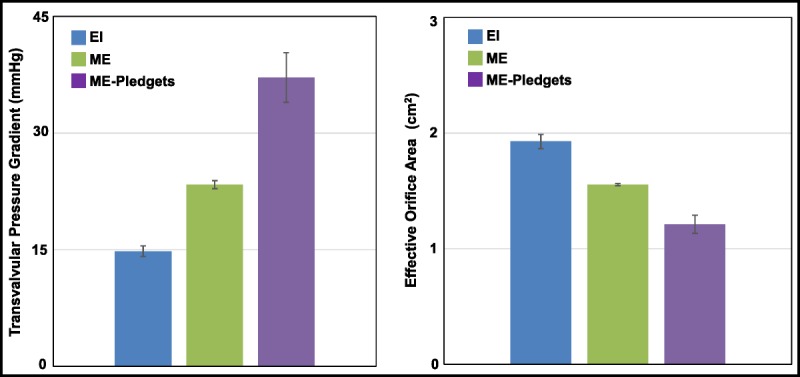
FIGURE 6.

A bar graph showing the TPG (left) and EOA (right) for the EI valves with nominal frame expansion, ME valves without pledgets, and ME valves with pledgets. The bars show the mean ± SD for 4 different valves. The mean TPG and EOA were significantly different comparing the EI valves with the ME valves without pledgets (unpaired t test, P < 0.001). The mean TPG and EOA were significantly different comparing the ME valves without pledgets with the ME valves with pledgets (paired t test, P < 0.001). EI, EDWARDS INTUITY; ME, Edwards Magna Ease.
