Figure 4.
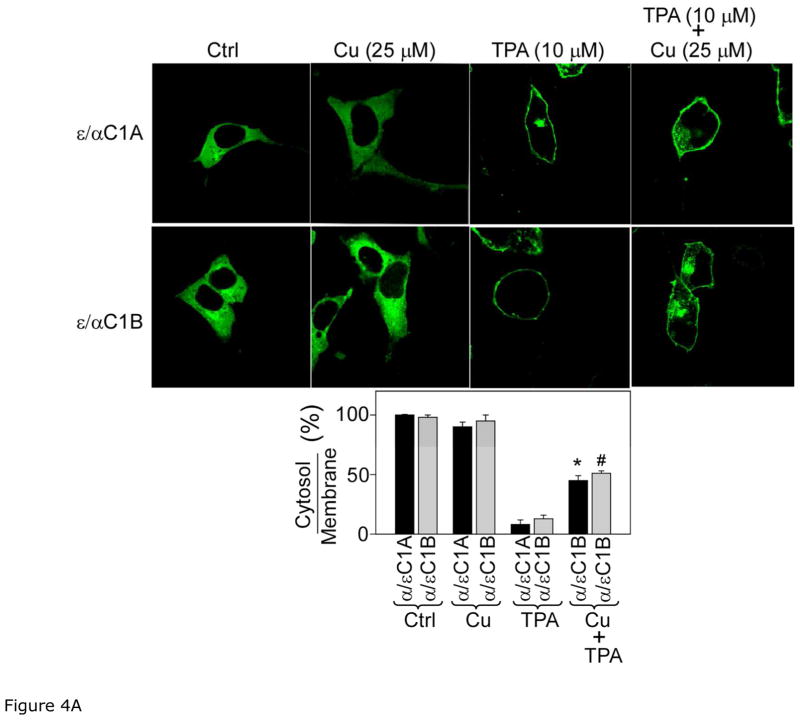
Figure 4A. Confocal analysis of the effect of curcumin on TPA-induced membrane translocation of ε/αC1A and ε/αC1B. The upper panel shows confocal images of ε/αC1A and ε/αC1B mutants after cells were treated with TPA (10 μM) and/or curcumin (25 μM) for 1 h. Control (ctrl) refers to the sample with vehicle (0.1% DMSO) treated cells. The lower panel bar graph shows the protein ratio of cytoplasm to plasma-membrane, quantified from fluorescence intensity of the upper panel images as described in Material and Methods section. Results are displayed as Mean ± SEM from three independent experiments and from three different cells. One-way ANOVA (Bonferroni post hoc test) was used for statistical significance analysis. *, P values less than 0.05 are considered as significant.
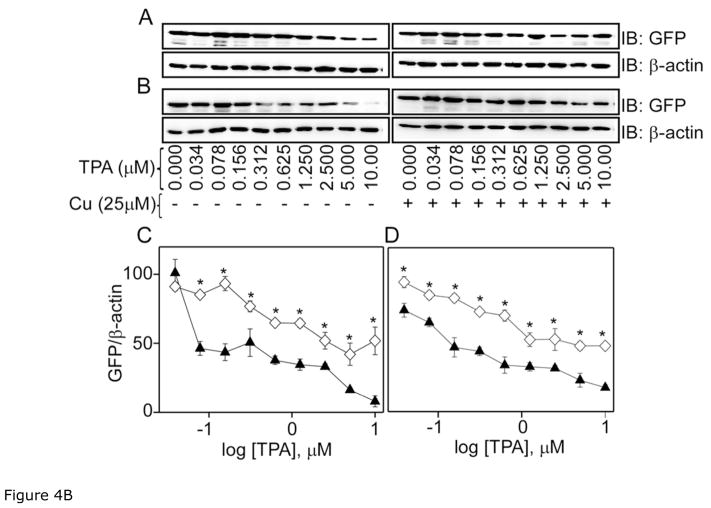
Figure 4B. Western blot analysis of the effect of curcumin on TPA-induced membrane translocation of the mutants, ε/αC1A and ε/αC1B. Upper panel shows Western blot analysis of cytosolic (A) ε/αC1A and (B) ε/αC1B after cells were treated with different concentration TPA (0–10 μM) (▲) and curcumin (25 μM) +TPA (◇) as indicated for 1 h. β-actin was used as a loading control. C and D in the lower panel represent the bar graph of densitometry analysis of panel A and B immuno-blots, respectively. Results are displayed as Mean ± SEM, n = 3 and one-way ANOVA (Bonferroni post hoc test) was used for statistical significance analysis. *, P values less than 0.05 are considered as significant.


