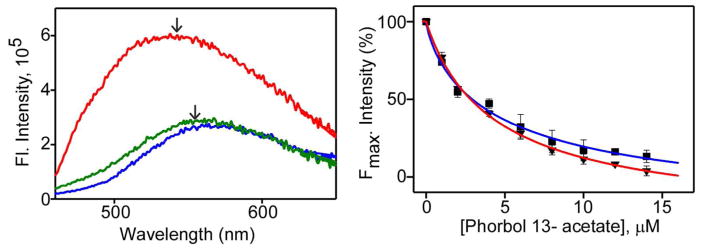
Fig 5.
Effect of phorbol 13-acetate on the binding of curcumin to αC1A and αC1B domain. Left panel, fluorescence emission spectra of curcumin (5 μM) in buffer (blue), buffer + αC1B (5 μM) (red), and buffer+ αC1B (5 μM) + TPA (10 μM) (green). Arrows indicate emission maxima. Right panel, normalized fluorescence intensity of curcumin in presence of αC1B (▼) or αC1A (■) at Emmax (565 nm for C1A and 552 nm for C1B) and as a function of phorbol 13-acetate concentration. IC50 was calculated from fitted curves using Hill equation (36) and indicated as solid lines. The IC50 of αC1A and αC1B were 6.27±1.2 μM and 4.47±1.7 μM respectively. Solutions were excited at 425 nm. Results are displayed as Mean±SEM from three independent experiments.

