Figure 6.
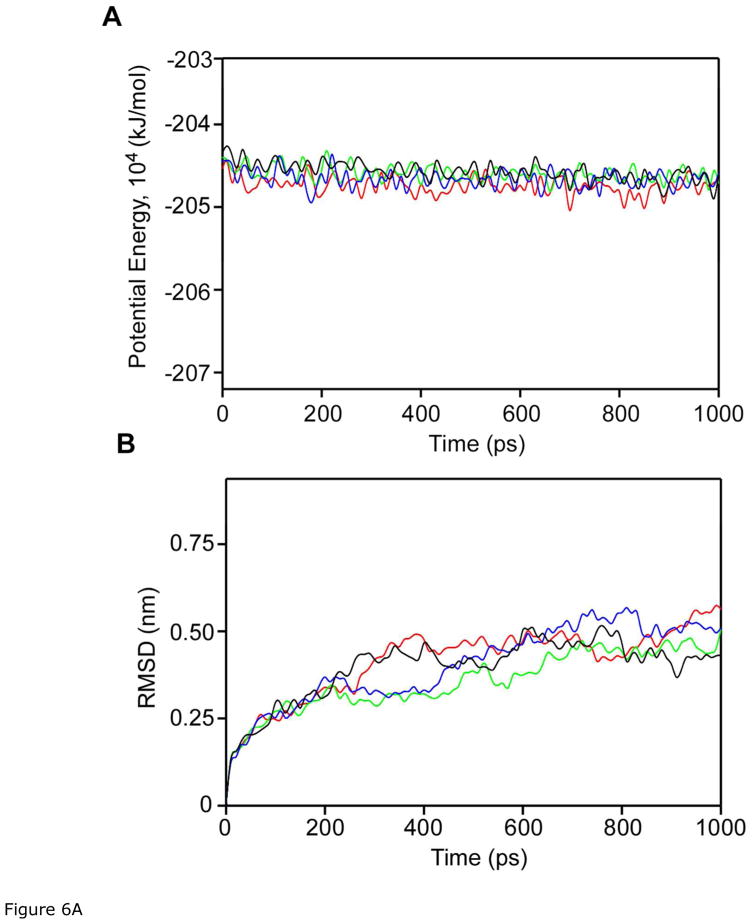
Fig 6A. Plots of (A) potential energy and (B) RMSD resulted from the MD simulations of free (red), curcumin docked to C1A (green), curcumin docked to C1B (black), and curcumin docked to C1A and C1B (blue) during 1.0 ns MD.
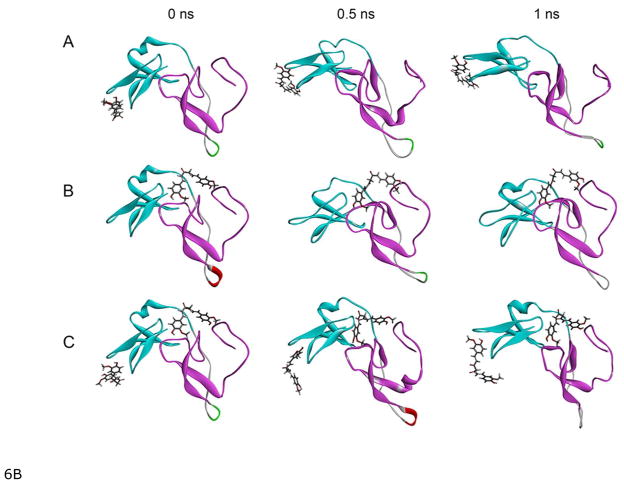
6B: Snapshots at 500 ps intervals of the MD simulations of the complexes of curcumin and the C1 (C1A+C1B) domain of PKCα. A) Curcumin docked to C1A, B) curcumin docked to C1B, and C) curcumin docked to C1A and C1B. Cyan and magenta color represents C1A and C1B domain respectively, and curcumin is represented by the line structure. The MD simulations were carried out using the GROMACS 4.6.5 package of programs.


