
Figure 1.
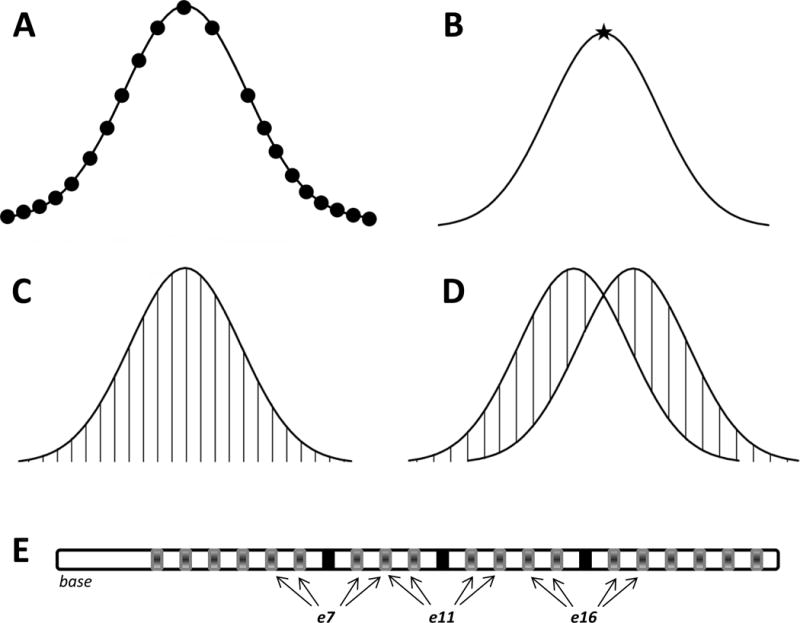
Schematic of outcome metrics. Each curve represents a hypothetical SOE pattern. A) Mean amplitude was calculated by averaging ECAP responses across all masker electrodes (black circles), excluding the recording electrode (empty space). B) Peak electrode was the masker electrode number that generated the largest ECAP amplitude across each SOE function (black star). C) Area under the curve (sum of vertical lines) was calculated as the cumulative sum of normalized ECAP amplitudes in the function after interpolating for the recording electrode. D) Spatial separation between SOE functions was calculated as the sum of the absolute value of the difference in normalized amplitude between paired functions for each masker electrode location (sum of vertical lines). E) Depiction of the electrode array showing probe pairs used to calculate spatial separation. The three regions are denoted by three sets of arrows. Reference electrodes (e7, e11, and e16) are shown using black rectangles. Arrows point to the other electrodes (shown using grey rectangles) that are compared to these reference electrodes.