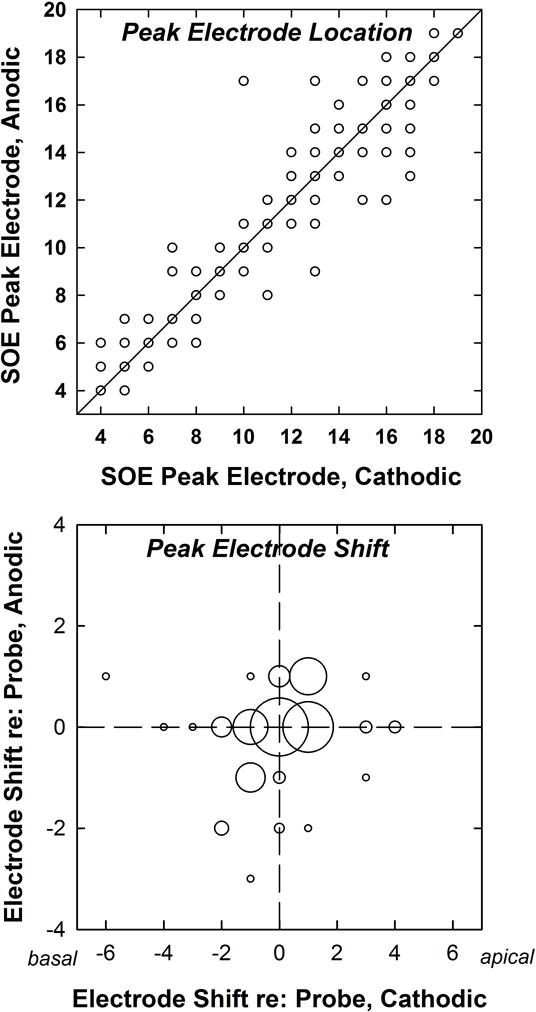
Figure 4.

Top: Electrode location of the peak of the SOE function for anodic-leading compared to cathodic-leading stimuli. Each dot represents the peak electrode location of an SOE pattern for one probe electrode for one subject (14 per subject; 224 total data points). The diagonal line denotes equal peak electrodes for both polarities. Bottom: Bubble plot indicating the degree to which the peak of the SOE function shifted relative to the probe electrode. Negative and positive numbers represent the number of electrodes by which the peak shifted in the basal or apical direction, respectively. Bubble size corresponds to the number of occurrences at each coordinate, where the largest bubble represents 66 SOE functions and the smallest eight bubbles each represent one SOE function.
