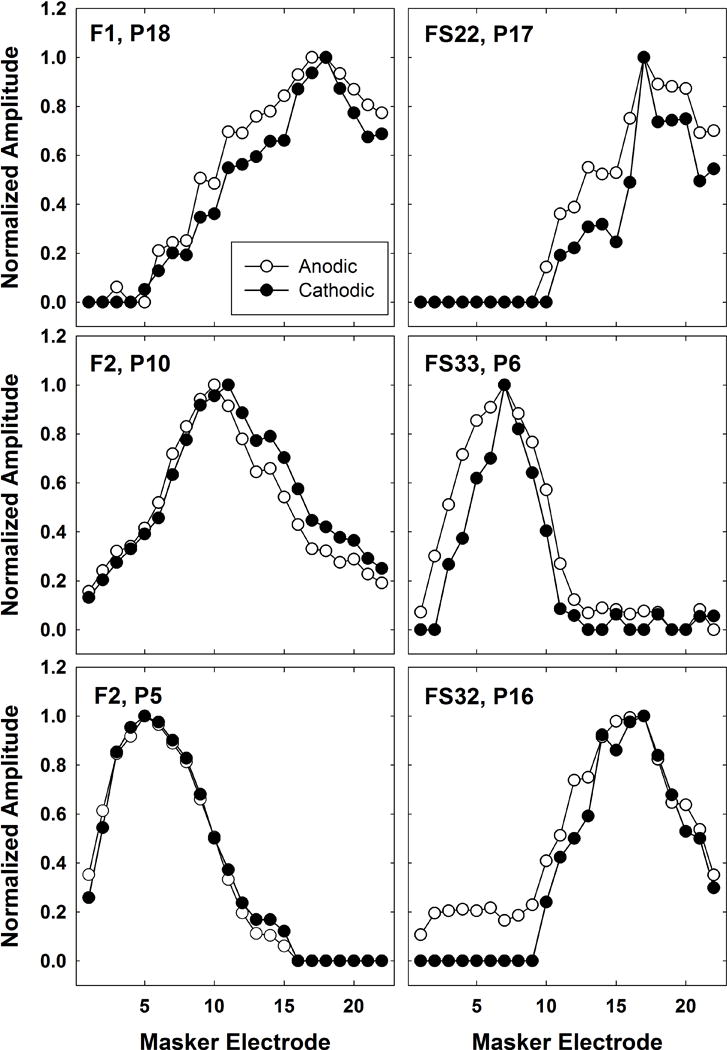
Figure 5.

Individual examples of pairs of normalized SOE patterns obtained with anodic-leading (open circles) and cathodic-leading (filled circles) stimuli. Each pattern has been normalized to the peak of its own function to allow for comparisons of area under the curve while controlling for overall amplitude differences. Subject number and probe electrode are indicated on each panel.
