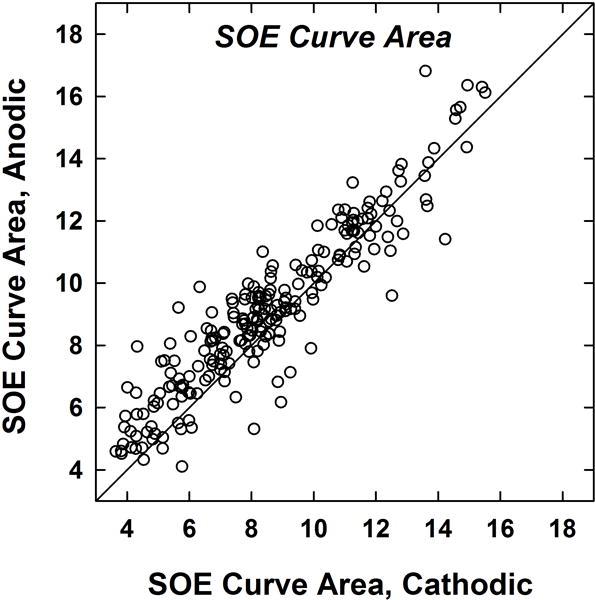
Figure 6.

Area under the curve (see text) for normalized SOE functions obtained with each polarity. Each dot represents an SOE pattern for one probe electrode for one subject (14 per subject; 224 total data points). The diagonal line denotes equal curve areas for both polarities. Data points above the diagonal represent larger curve areas (broader SOE patterns) for anodic-leading stimuli.
