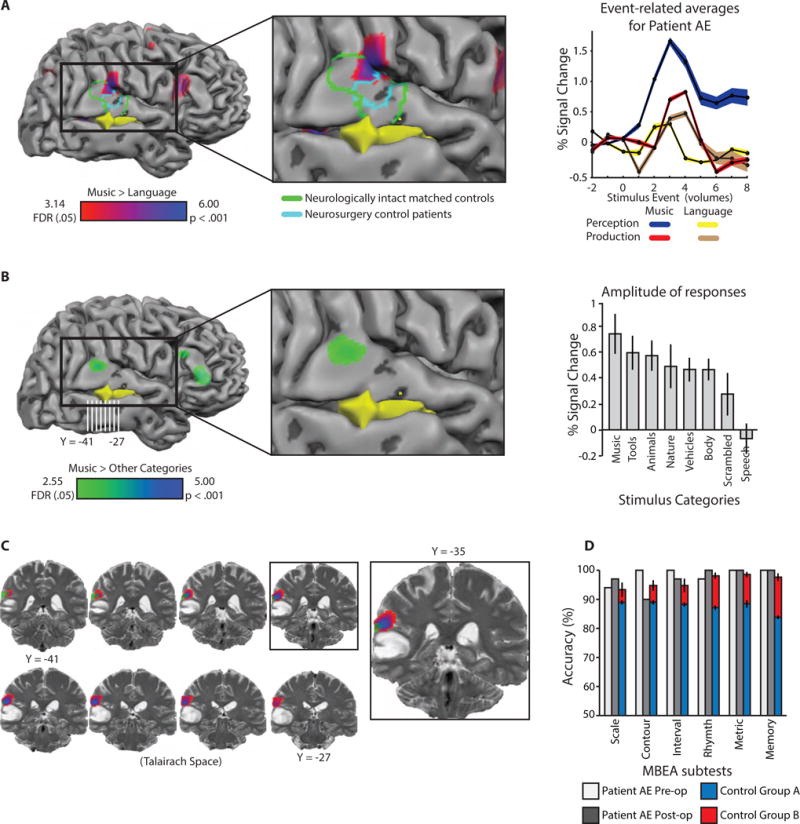
Figure 1. Music processing in the right superior temporal gyrus.

A. Voxels exhibiting increased BOLD contrast for melody compared to sentence repetition in the vicinity of the right superior temporal gyrus (red-blue color scale; t ≥ 3.14, whole-brain FDR q < .05; peak coordinate [57 -34 22]). The tumor is represented in yellow. A group of four neurologically intact age and music-education matched control participants took part in the same experiment (data are plotted in green outline on Patient AE’s brain to facilitate comparison, t ≥ 2.51, FDR q < .05). A separate group of ten neurosurgery patients also completed the same experiment pre-operatively (data plotted in cyan, t ≥ 2.26, p < .05, uncorrected). Event-related time series indicate Patient AE’s neural responses in the right superior temporal gyrus were maximal for music perception. B. There was increased BOLD contrast for music stimuli (e.g., guitar strumming, piano playing) compared to other categories of sounds (e.g., vehicle sounds, human bodily sounds, animal sounds) in the right superior temporal gyrus (green-blue color scale; t ≥ 2.55, FDR q < .05; peak coordinate [57 -37 19]). An ROI analysis (Figure 1B) demonstrated increased BOLD signal for music stimuli compared to tool, animal, nature and vehicle sounds, human bodily noises, a scrambled baseline condition, and human speech. C. Coronal images of music preferences overlaid on a pre-operative T2 anatomical image. D. Patient AE performed within control range on the Montreal Battery of Evaluation of Amusia (MBEA) pre- and post-operatively. The small decrement in AE’s performance for contour discrimination post-operatively was not significantly different from controls (t < 1). All error bars represent the standard error of the mean, across participants. See also Figure S1.
