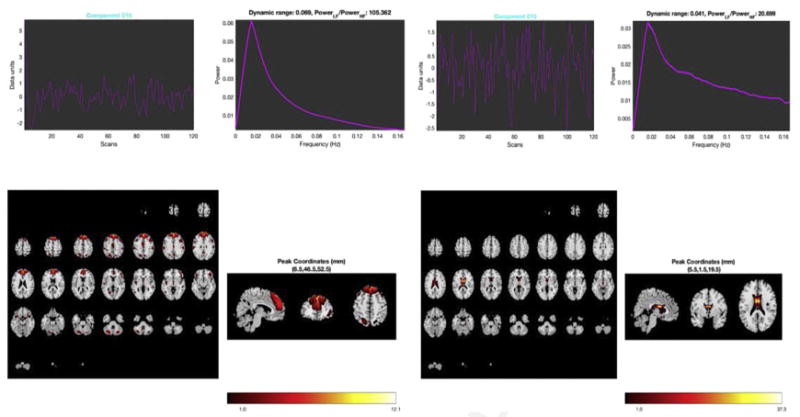
Fig. 10.

Comparison of components extracted from 75 component ICA performed on resting-state data with 120 time points in 1190 neurotypical young adults. On the left is an intrinsic network or good component. Note the smooth shape to the power spectra (dynamic range) and high low-frequency to high-frequency power ratio. The brain activation pattern is spatially aggregated and clearly in frontal gray matter areas. On the right is a bad component. Here, there is a shallow, ridged appearance to the spectra and low power ratio. Activation is restricted to the ventricles. Likely this component represents artifact from cerebrospinal fluid in the brain ventricles.
