
Fig. 11.
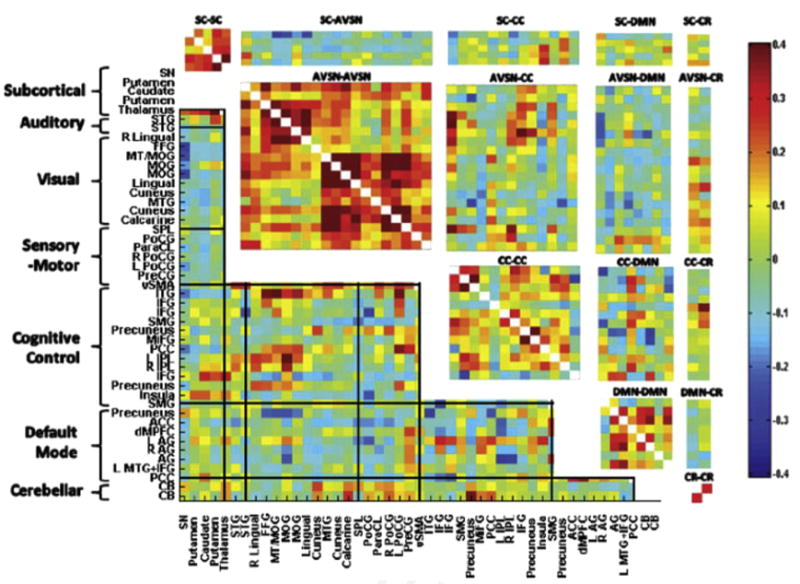
Population average of static windowed functional network connectivity matrix; that is, using all 162 time points (no windowing) for 47 ICA components (networks) obtained from a group ICA decomposition. Grid lines bound 7 functional domains. Rectangular pull-outs are 15 joint functional domain connectivity blocks estimated from the ICA data using the approach described by Miller and colleagues. (Data from Miller RL, Vergara VM, Keator DB, et al. A method for inter-temporal functional domain connectivity analysis: application to schizophrenia reveals distorted directional information flow. IEEE Trans Biomed Eng 2016;63(12):2525–39.)