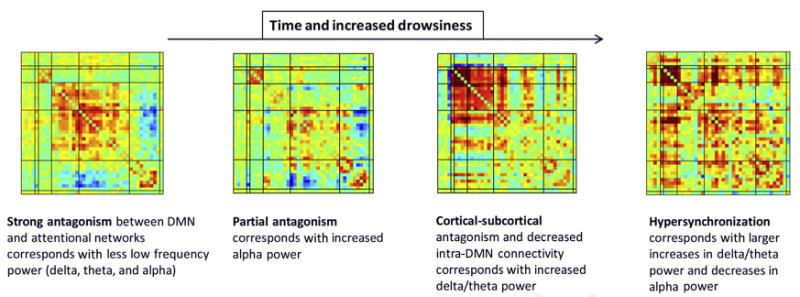
Fig. 12.

Example of dynamic functional network connectivity states estimated from a resting fMR imaging data set for which concurrent EEG data were also collected. Ordering the fMR imaging states according to EEG drowsiness measures reveals a striking pattern, because drowsiness increases the anticorrelated functional connectivity with the default mode network and diminishes that with other networks.
